Customer complaint system

Problem definition:
A “customer complaint” was everything with that content recorded by standard postal mail, email, fax, phone-call, etc. anywhere in the company. Evaluation wasn´t possible.
Situation before:
Customer complaints were communicated informally by fax, telephone, letter or e-mail. This meant that the complete information was never available to begin a thorough technical investigation of the problem. There always had to be a query, which was time-consuming and error-prone, as human communication had to take place in every direction. All the information about a complaint was then stored in an Office document in the file system and only the ten most important pieces of data were written to a summary table on the server using a macro.
· Every field in the Office document had to be filled by hand
· No real evaluations available
· Very long throughput times
· Very complex processing
· Decentralized document route
· No status overview possible
· No recognizable connections
Situation afterwards:
After roughly determining the scope of functions, I started analyzing and structuring the required data. At the same time, a new workflow (1 path instead of completely arbitrary paths) had to be planned and coordinated with those responsible. As there was no one responsible and therefore no idea for the design of the overall process, the coordination and development were very exciting. Old habits had to be broken and new processes had to be consistently implemented and lived. The benefits were immediately apparent to most people and the user acceptance was high.
With the newly developed database
the organization of the entire error reporting system was structured into customer- & internal-complaints (between Group units) and error reports (within a unit) for technical & logistical problems
a single, authorized way of creating transactions, namely via a web interface, was established, where the processing status and the internal processor were also visible to the initiator
an incoming task was assigned to the responsible clerk depending on its type, who then found it in his task list
all unnecessary typing work could be avoided, as all necessary master data and information from the ERP system was available in the process context
an uniform, hierarchical error classification and multiple classification was possible
a consistent authorization concept has been set up for:
the inspection / processing of transactions
the processing and feedback of measures
the replacement in the event of illness or vacation
viewing & editing documents
the modification of completed transactions
the overall ergonomics were improved:
The complete processing & consolidation of data and dependencies regarding a complaint was possible on ONE screen page
a user-specific worklist preparation and management was enabled, including deputy & supervisor function (“show me my area”)
the status overview of a process at a glance with direct access to the sub-functions was possible
the workflow for processes (in the system) and tasks (system-independent!) was created
the prioritization of internal & external processes became possible
a categorized measures management system with measure tracking was established
it was possible to implement workflows for measures independently of the system (mail/browser-based results feedback)
the systematic tracking of measures and effectiveness reviews in accordance with
Runtime
Dunning levels
Number of shifts
Category
was possible.
further additional functions were set up such as
a system-supported dunning process for overdue measures
a resubmission option for measures
checklists stored for measures
effectiveness checks at measure and process level
grouping and summarizing error patterns
a mail system with flexible mailing list composition depending on the problem
document management
various cockpit functions (general & user-specific)
complex search functions including "bulk search" (inserting entire Excel columns
and searching for their content in combination with other parameters)
8D report creation with version management
comparison of existing quality management agreements
optimized processing of complaints from different customers based on the same error event
user and workgroup management
creation of Excel forms for completion by external editors and their re-import
evaluations, classifications, KPIs
complete (verbal) classification of complaints including
Causing part - WHO?
Error code - WHAT?
Cause category & cause code - WHY?
Causing workplace / supplier - WHERE?
the assignment of complaints to already known problems including
the evaluation of repeated errors
the automatic maintenance of a positive list of already solved problems
the possibility to quickly evaluate the database (ad-hoc reports)
from a data pool of 125,000 transactions
became possible.
additional information
Referencing existing customer quality management agreements with contract number
display of the
current order backlog
current stock levels
quantity of the item in question sold (monthly average / 4 * monthly average)
paragraph with date & customer number
contact person from the respective specialist departments for an article relating to the claimed article
context-sensitive retrieval of information from the product data cockpit
online translation of field content
temporary storage of processes or search sets for later use
runtime monitoring etc.
and much more
My system was used for 24 years and then replaced by a complete CAQ solution in the mid 6-digit range.
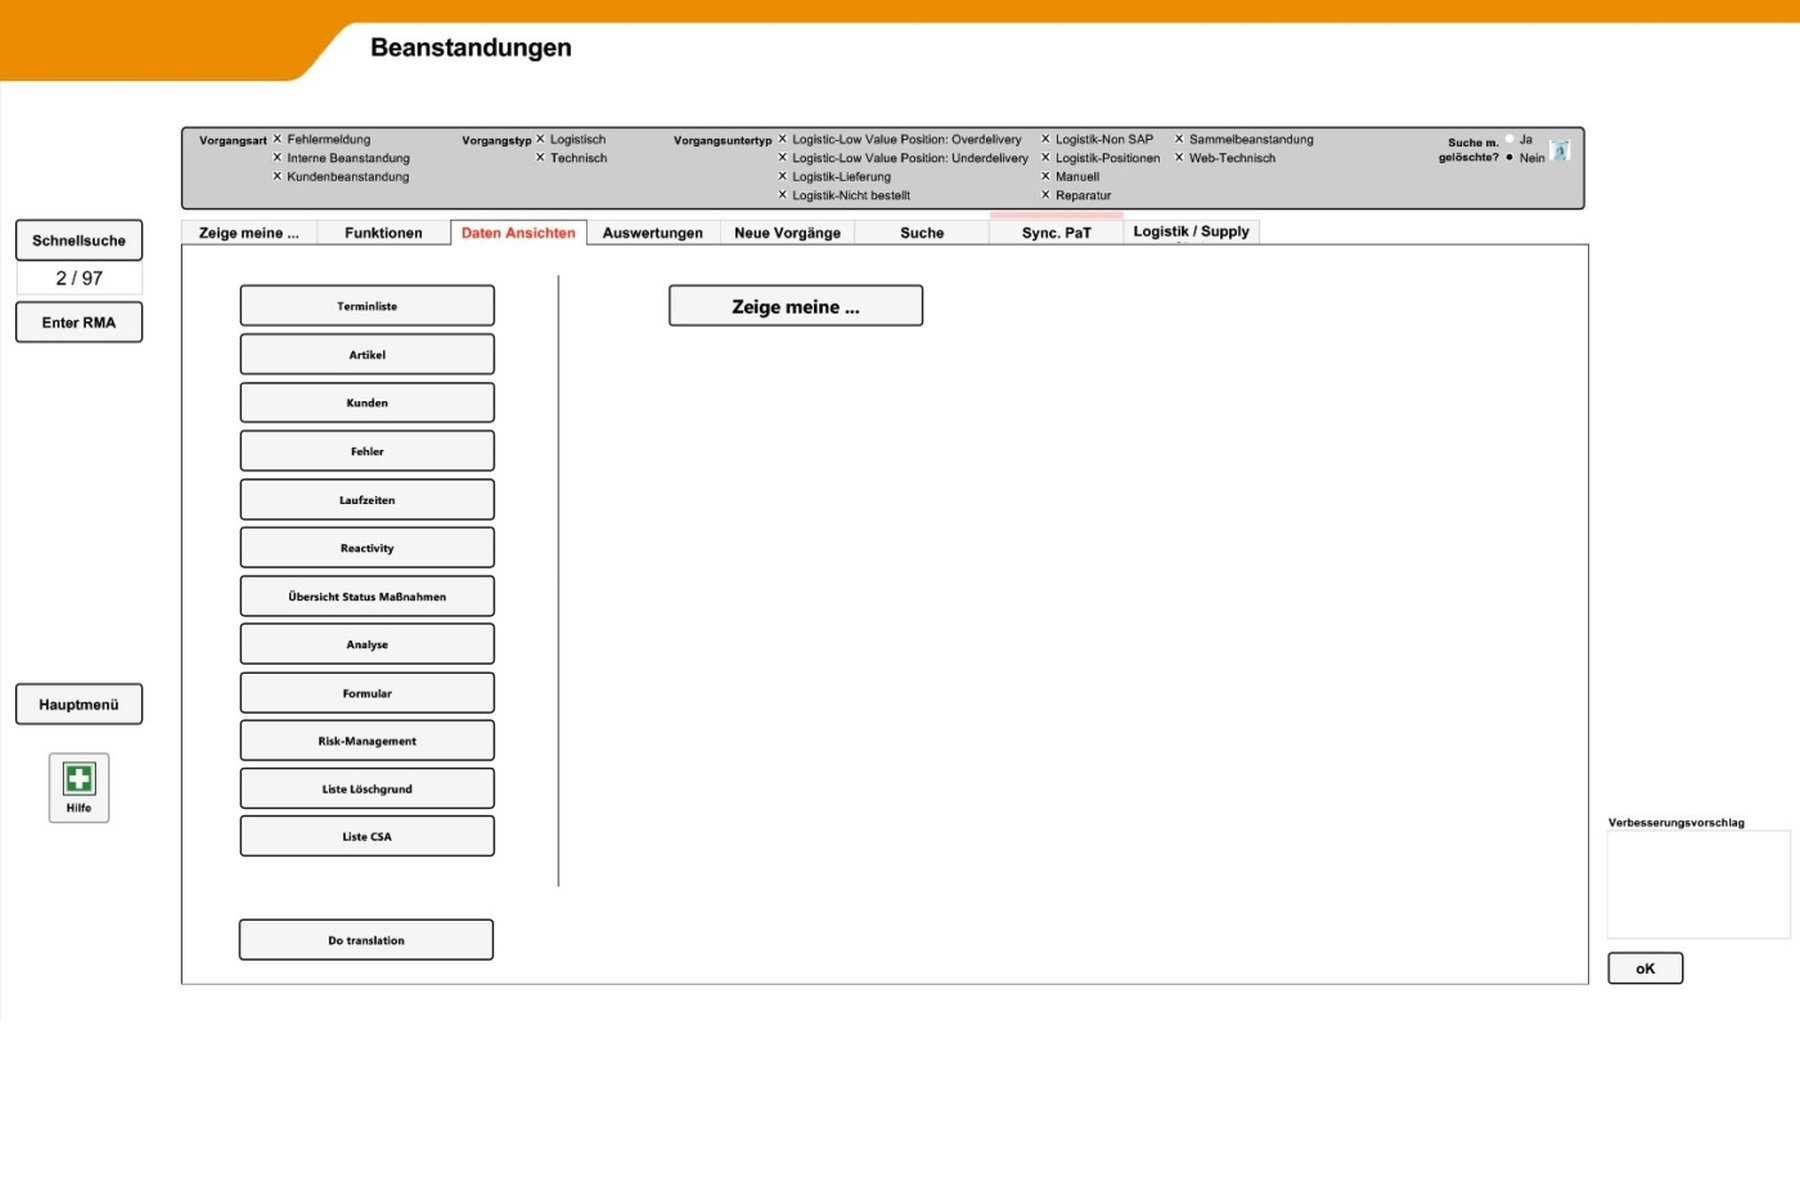
Menu - navigation
Menu - Show user´s subjects
Show feedback to user´s 8D-Report quality

Open pre-defined reports or system assisted search for reports

Custom reports/exports
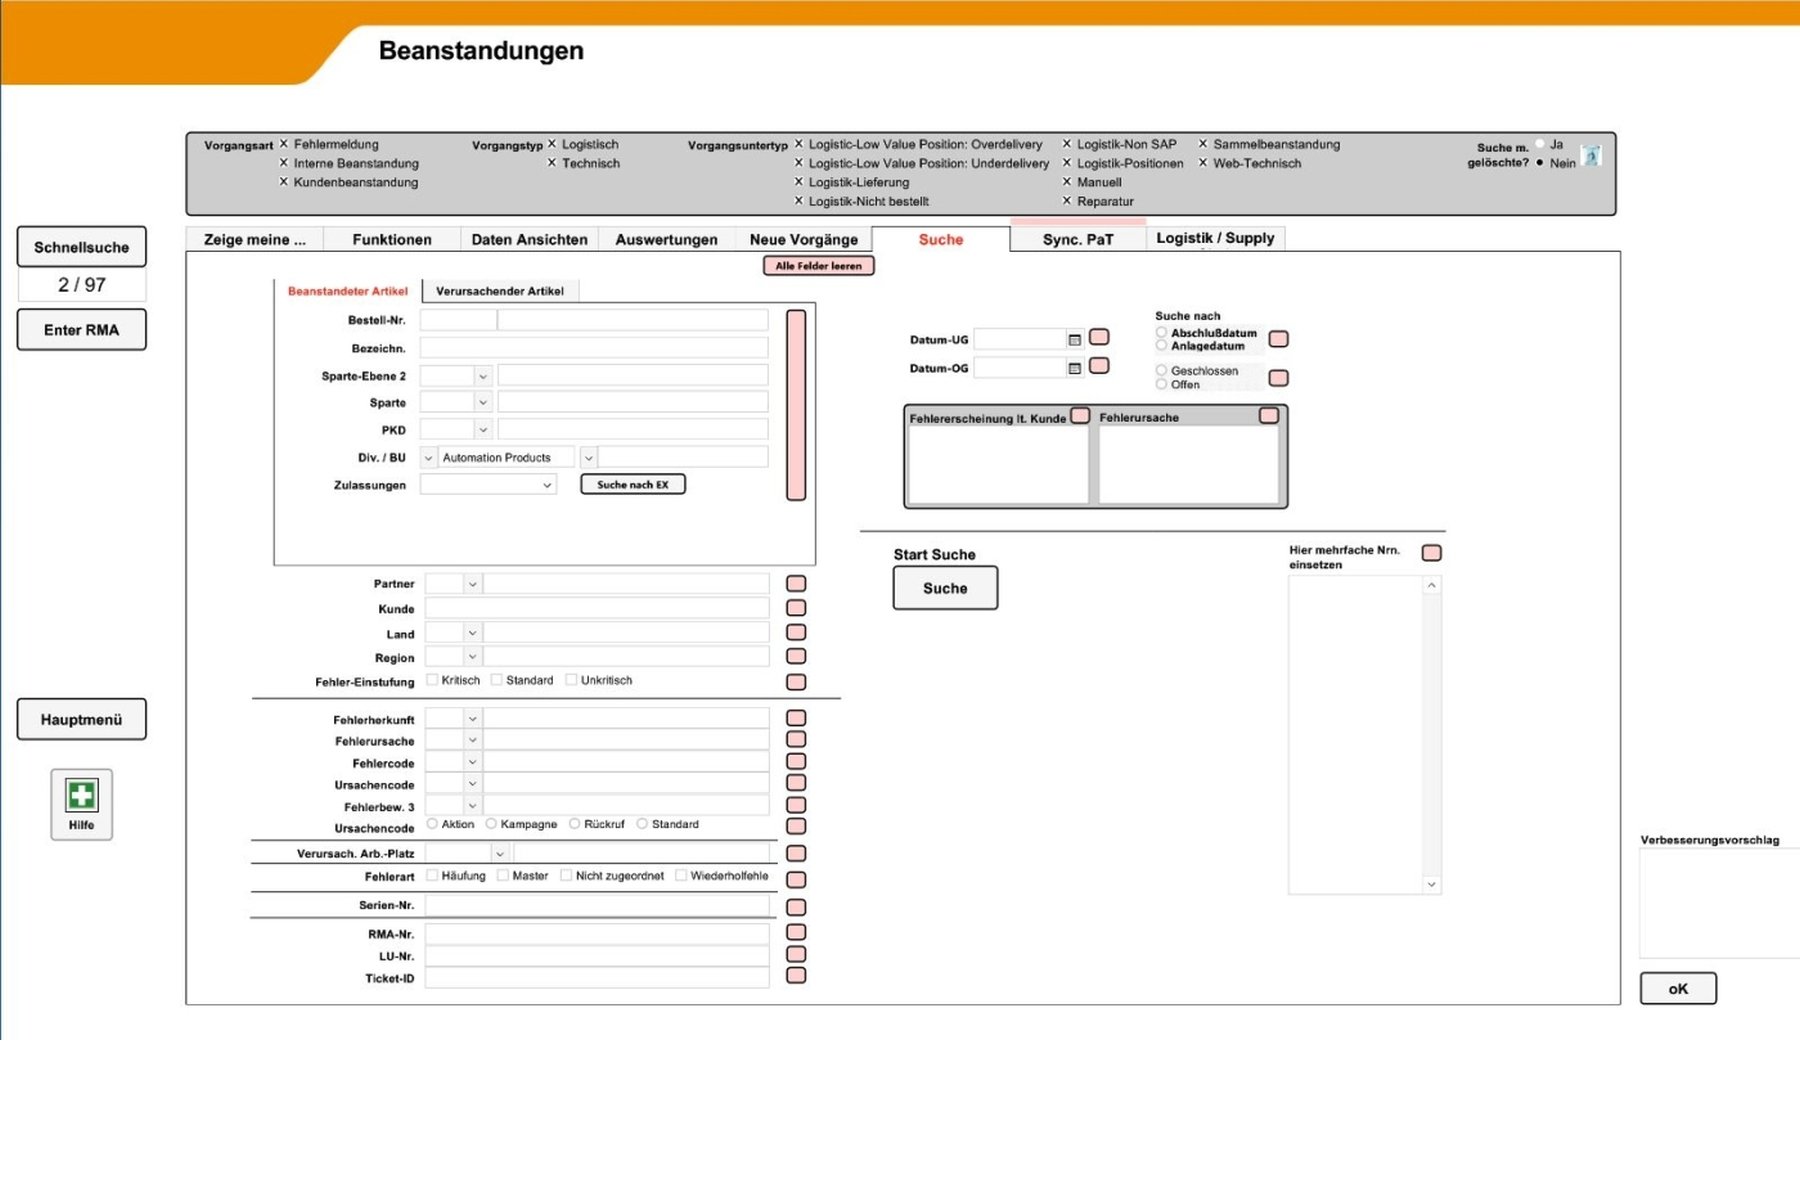
Menu of search options All entries are linked to the search with "and" and can be narrowed down further in later steps
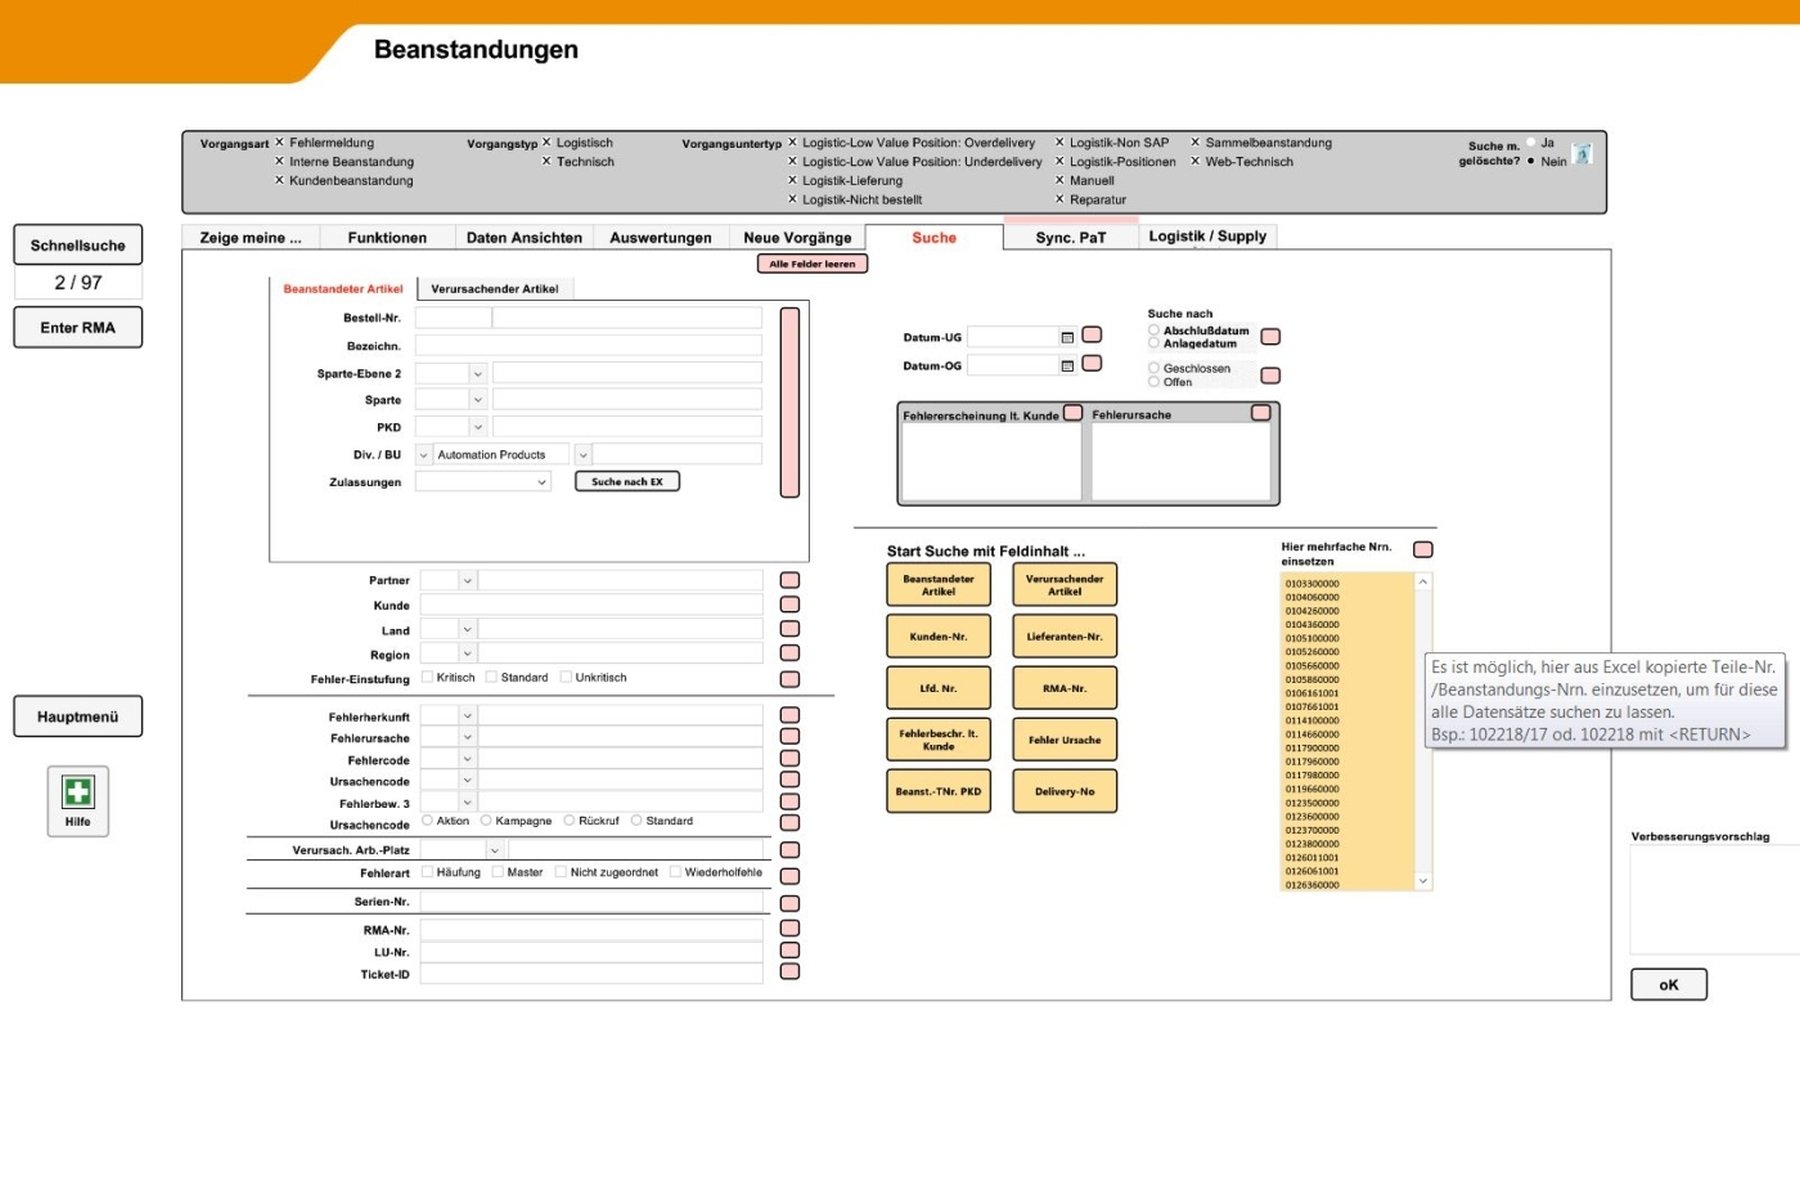
If, for example, many article numbers are copied from an Excel column and pasted into the elongated orange-colored field, the search for each of these article numbers is combined with all other search entries

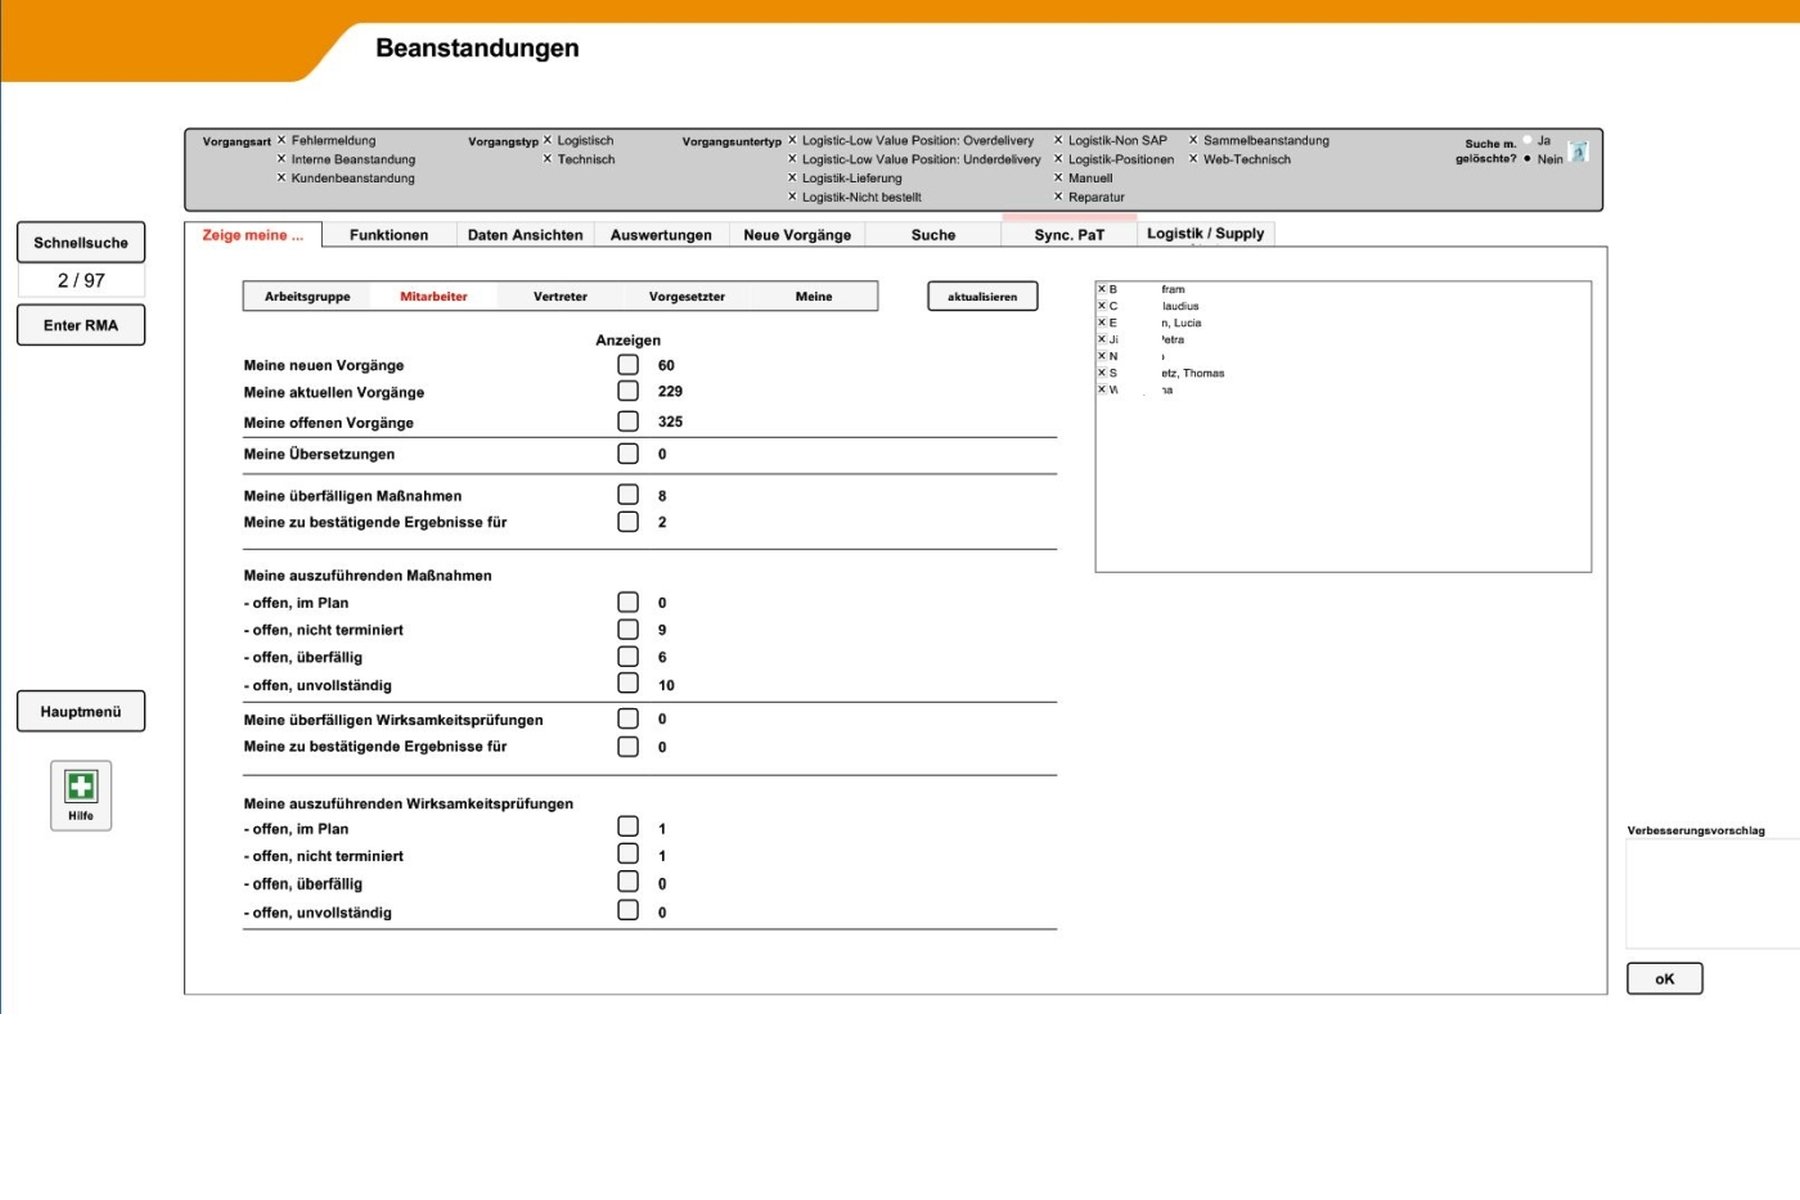
“Zeige meine” means “Show mine”: In this layout, all options are available for the user to obtain information about processes that affect them. The tabs (from left to right): - Newly created tasks - Tasks in which the user is entered as a processor - Their tasks that have not yet been completed - Actions that he has created or is to carry out - Effectiveness checks that he has created or is to carry out - Tasks that he has personally created manually - Tasks where he has to translate, as German is not spoken at all locations - Logistical tickets to the logistics service provider - Status of sample procurement for certain tasks If the user is a team leader, they can also display the tasks of their team members in the upper area. The system also supports working groups with defined substitutes. These representatives can also have their substitution tasks displayed here. The task types can be selected for display below the displayed tasks.

Further filtering can be carried out in the tab (here for measures). The group of records currently found can also be saved by clicking on the cardboard box icon so that it can be called up again later in a different view if necessary.
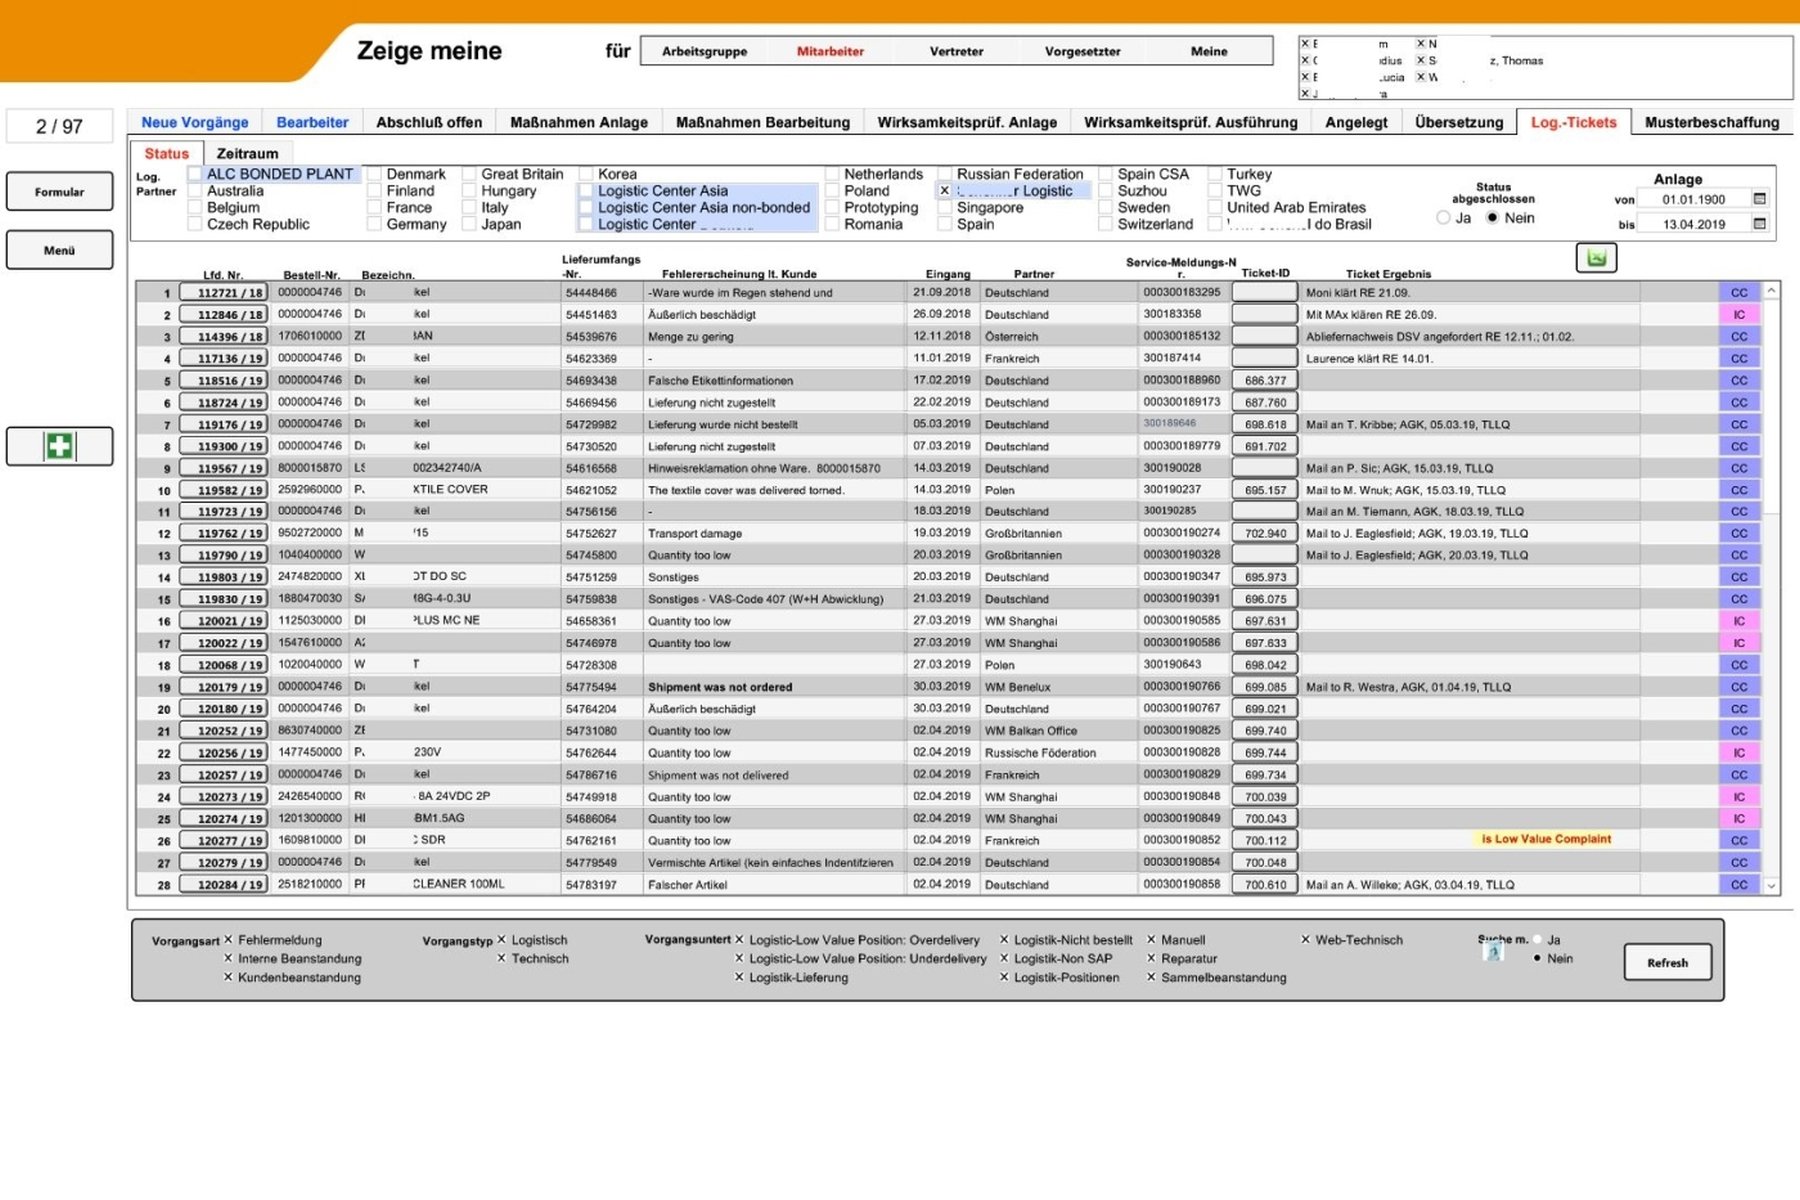
The logistics tasks can be filtered according to the respective logistics location and task type
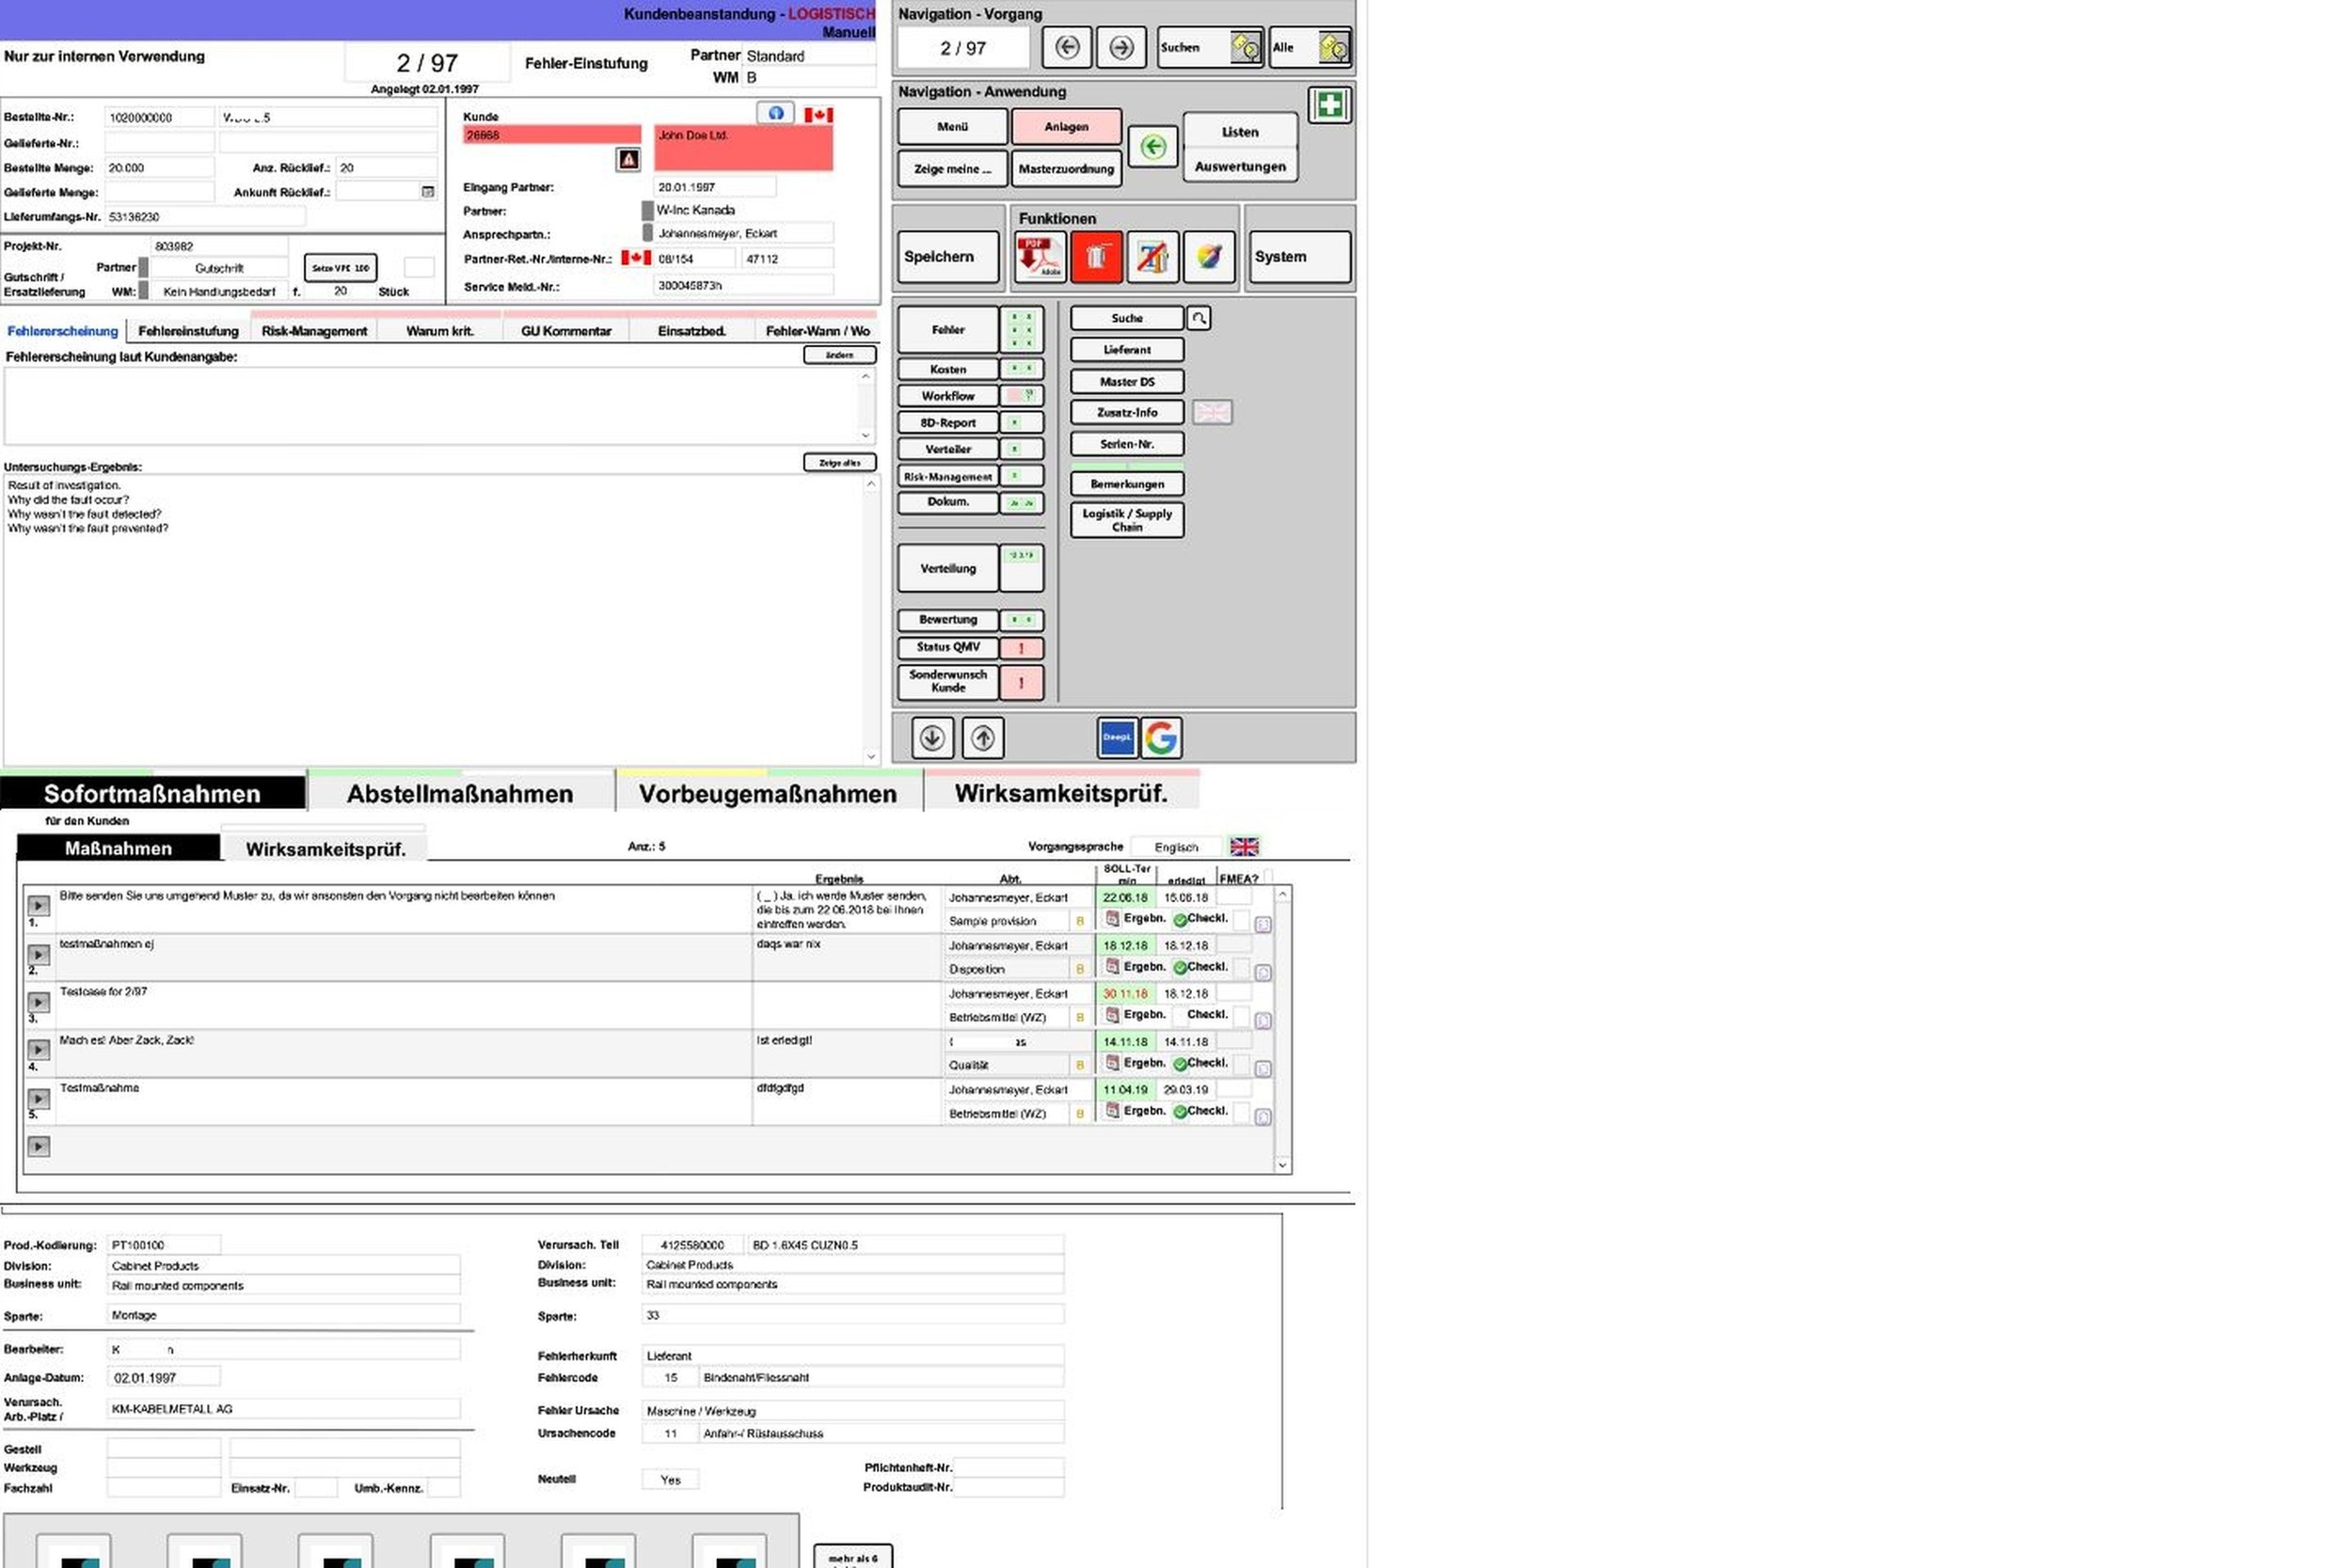
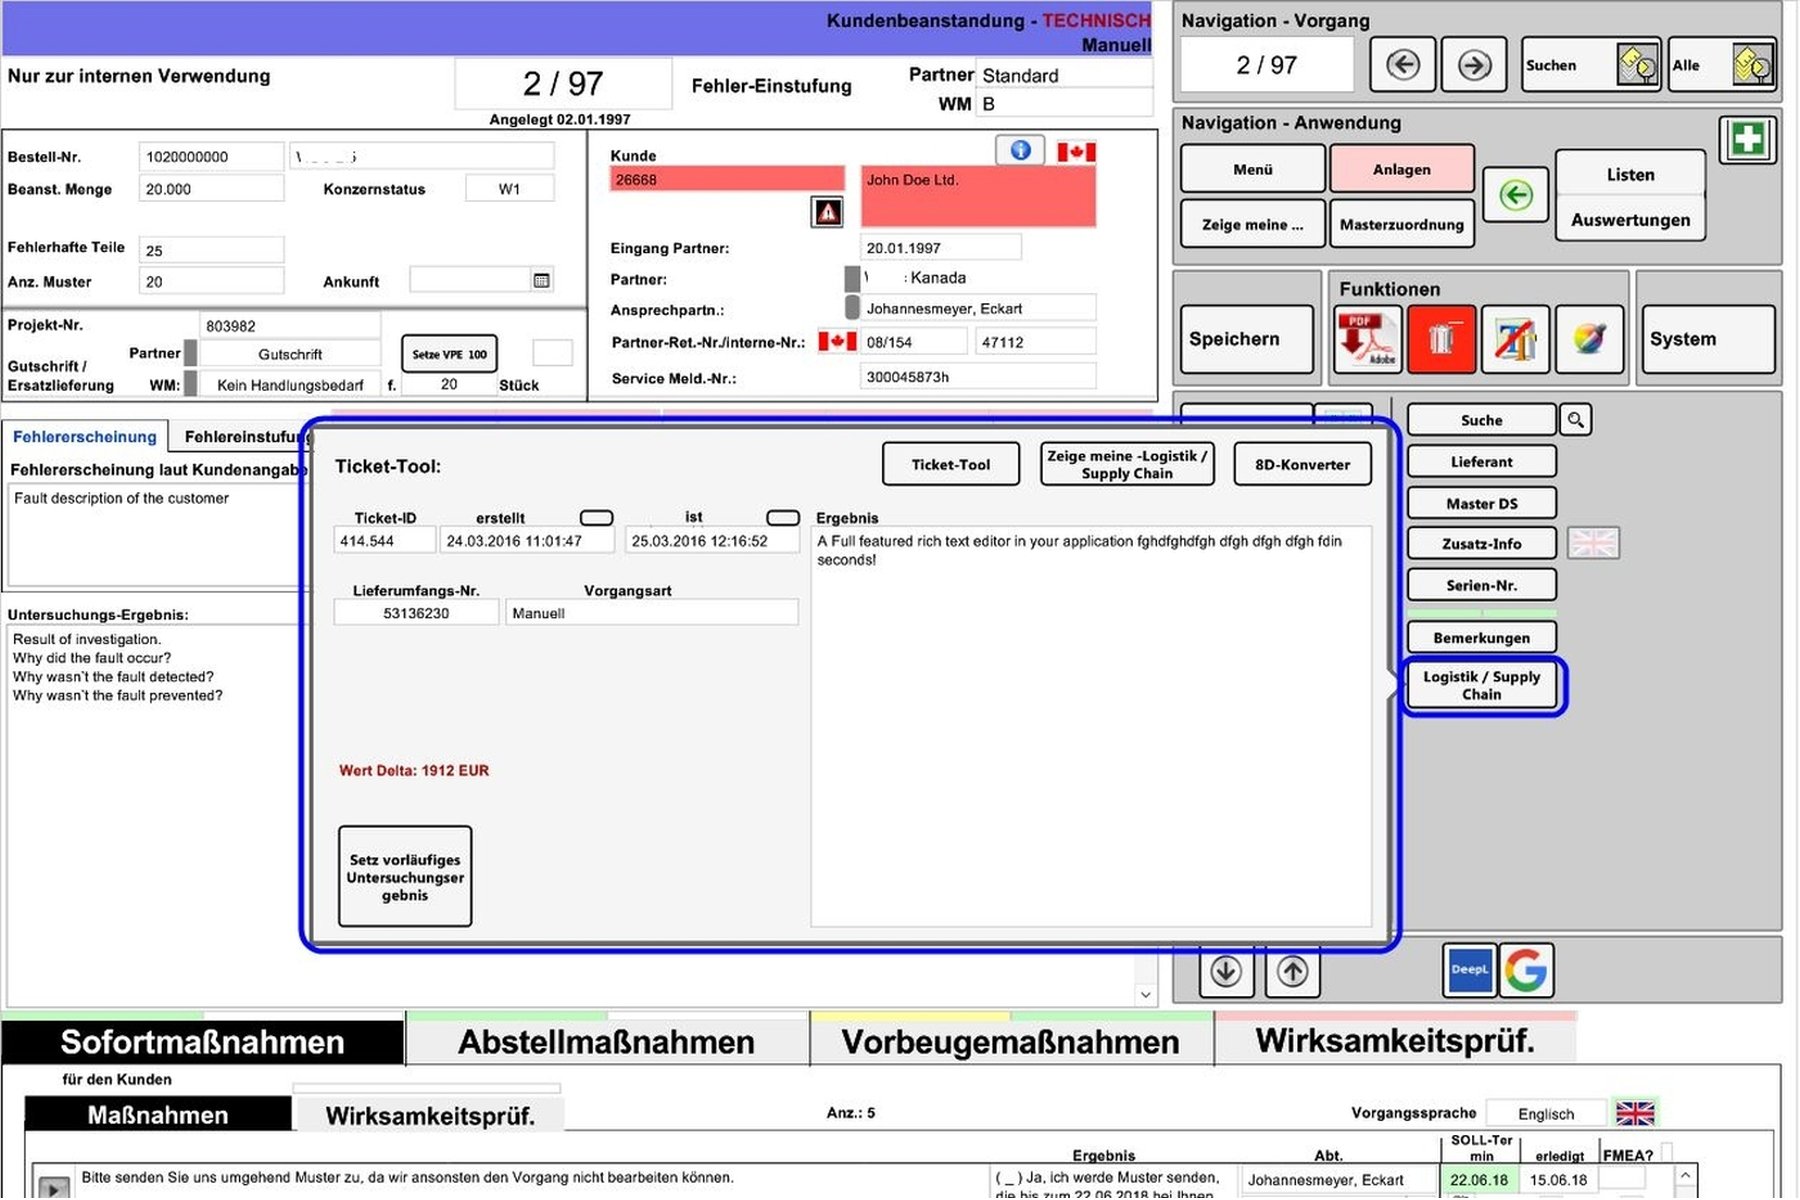
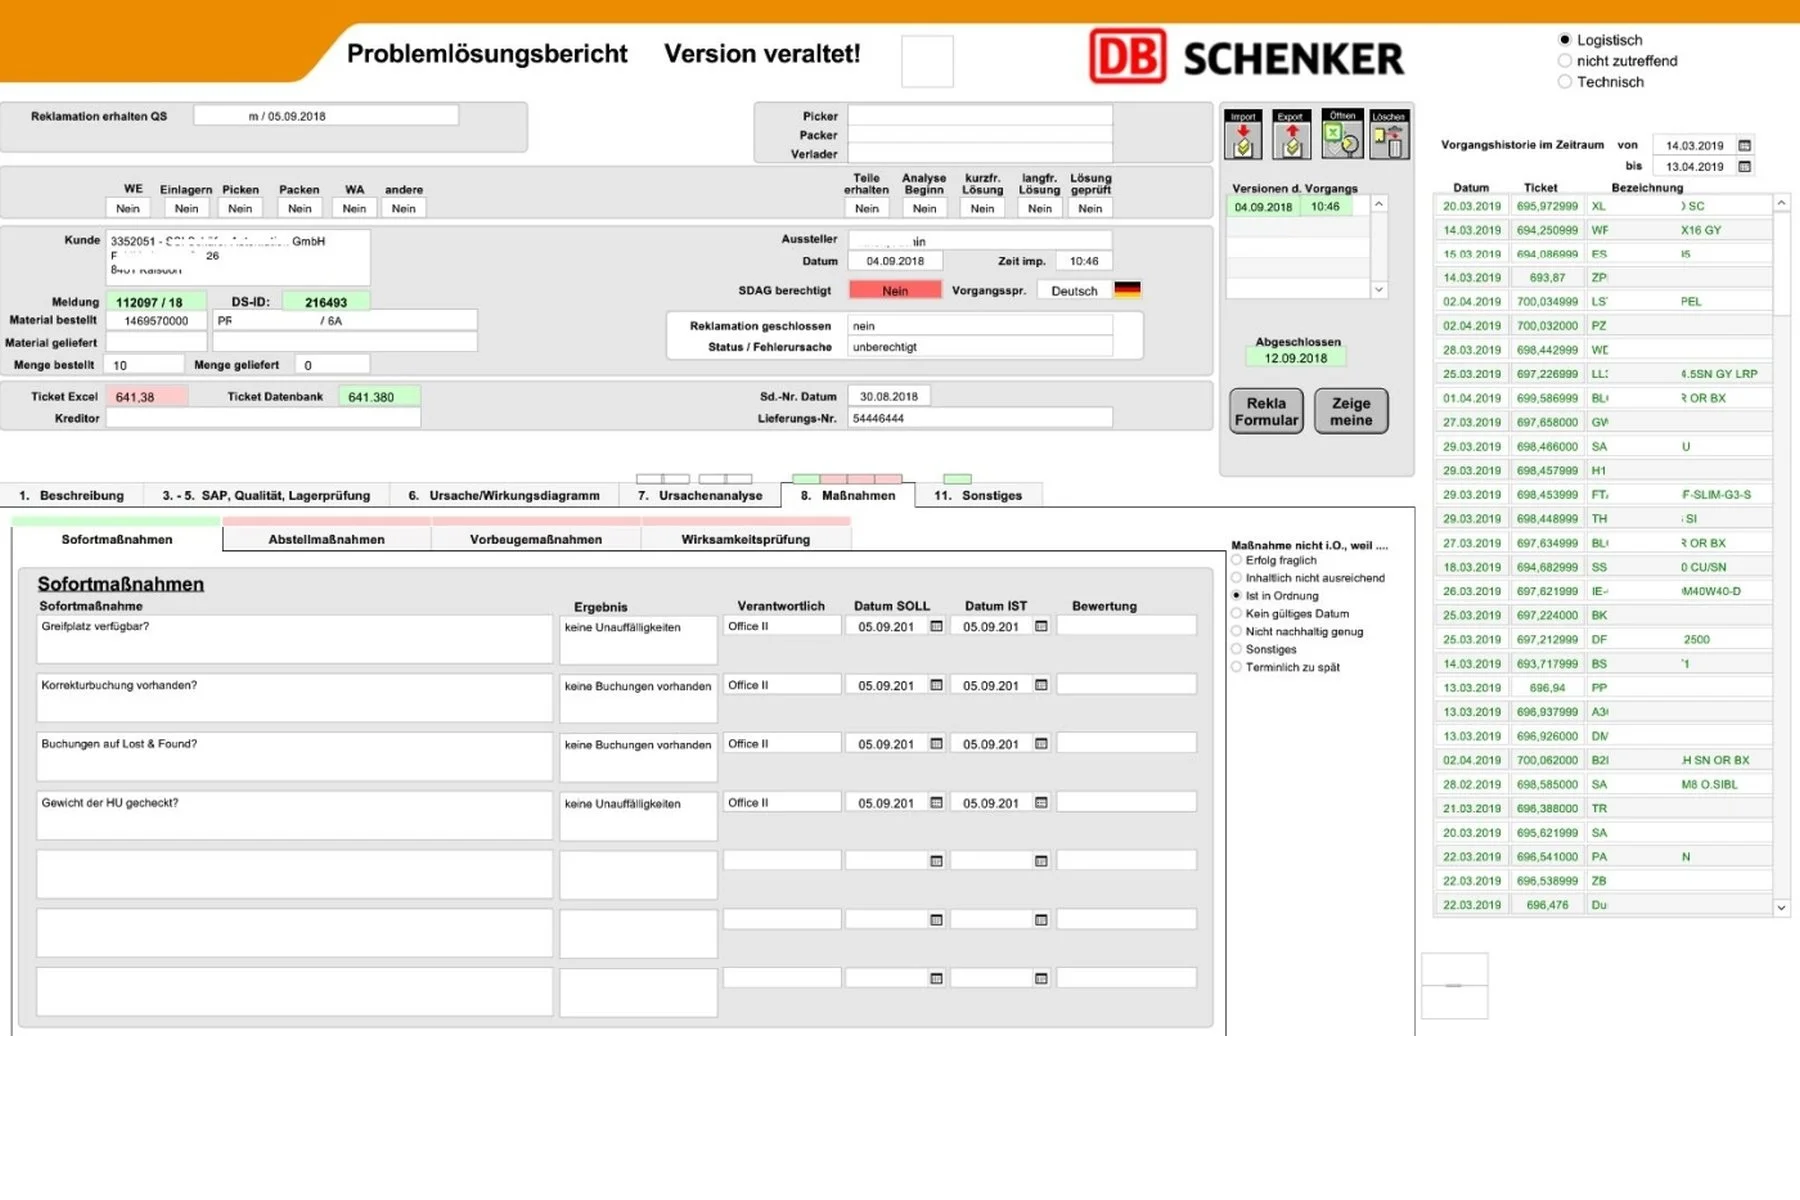
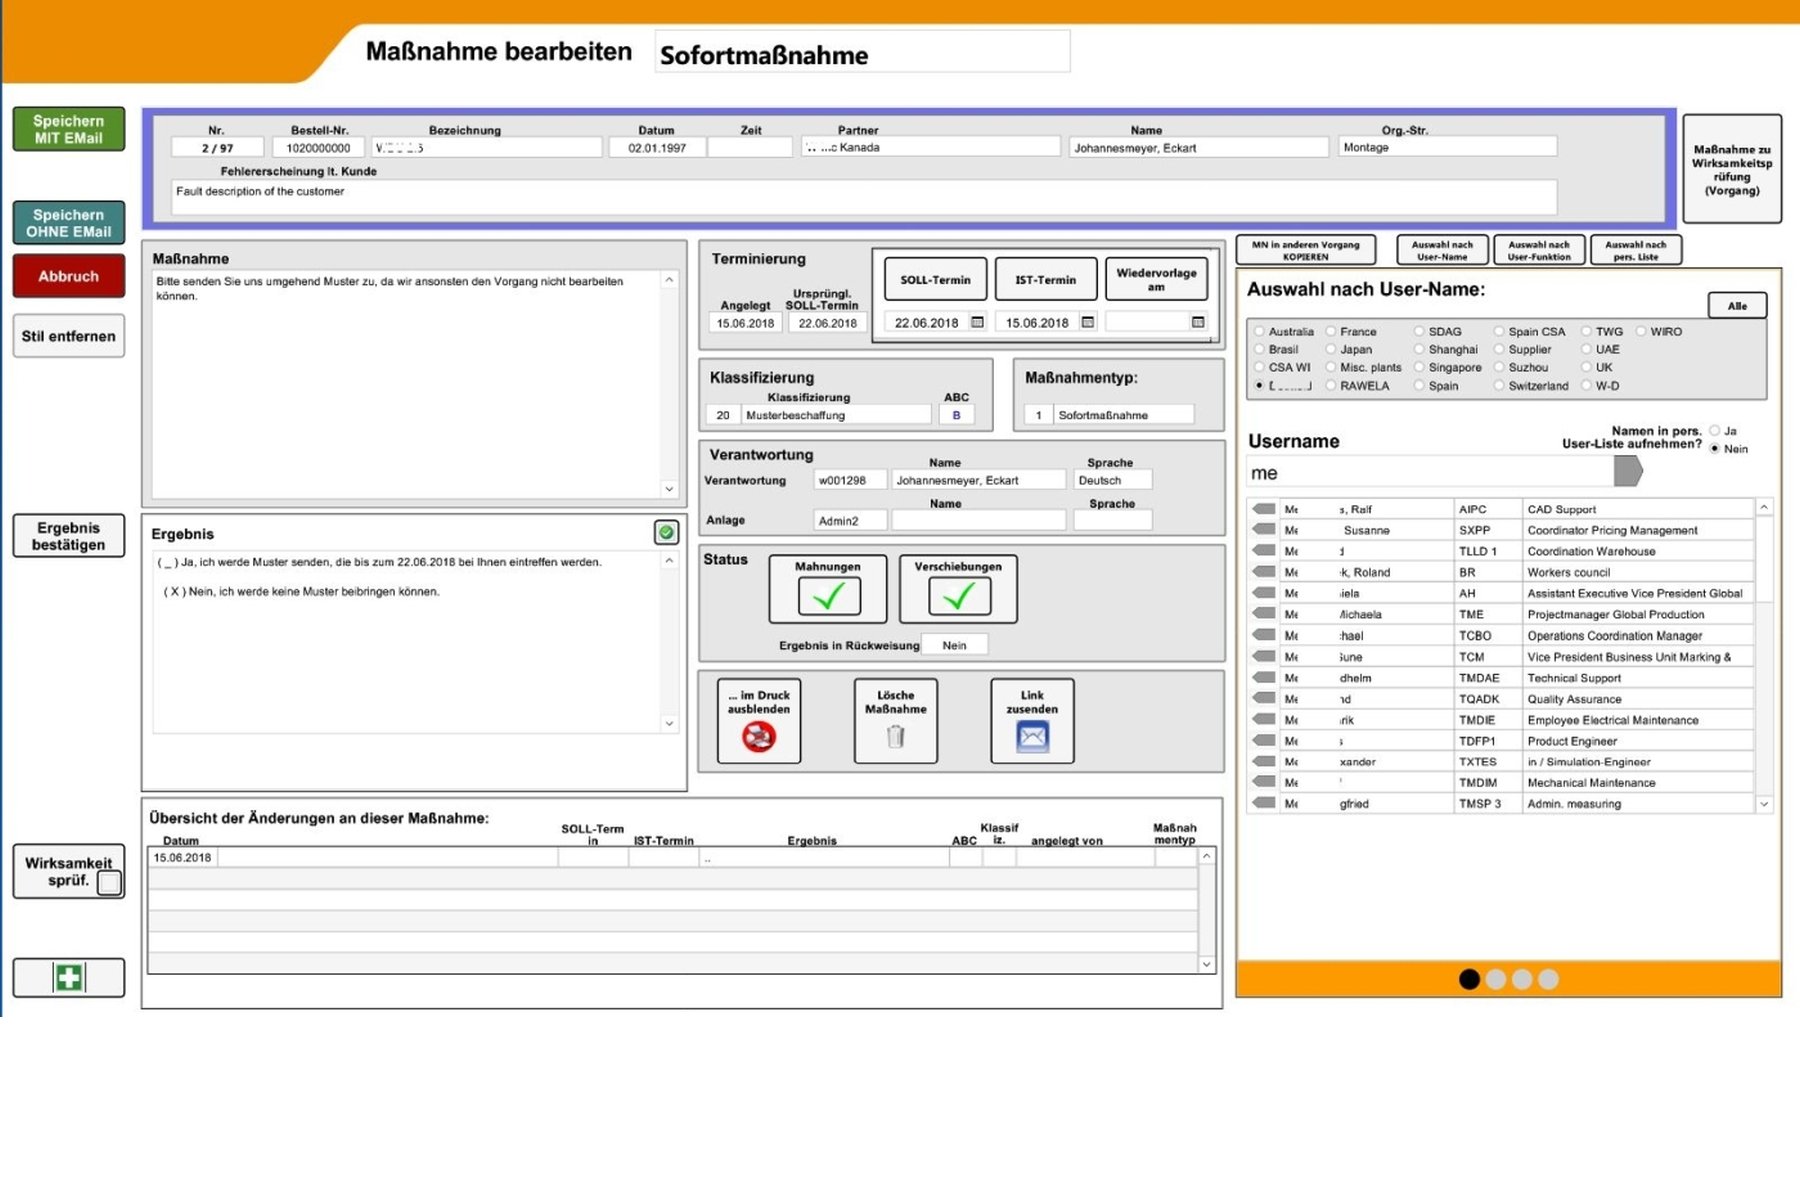
Top left: General data of the complaint Top center: General data of the customer and contact person Top right: Navigation menu and status displays Below: Customer's error description and the internal investigation result. Below: The block with immediate, corrective and preventive measures with scheduling, status and responsibilities Below that: Task classifications and attached images/documents Translated with www.DeepL.com/Translator (free version)
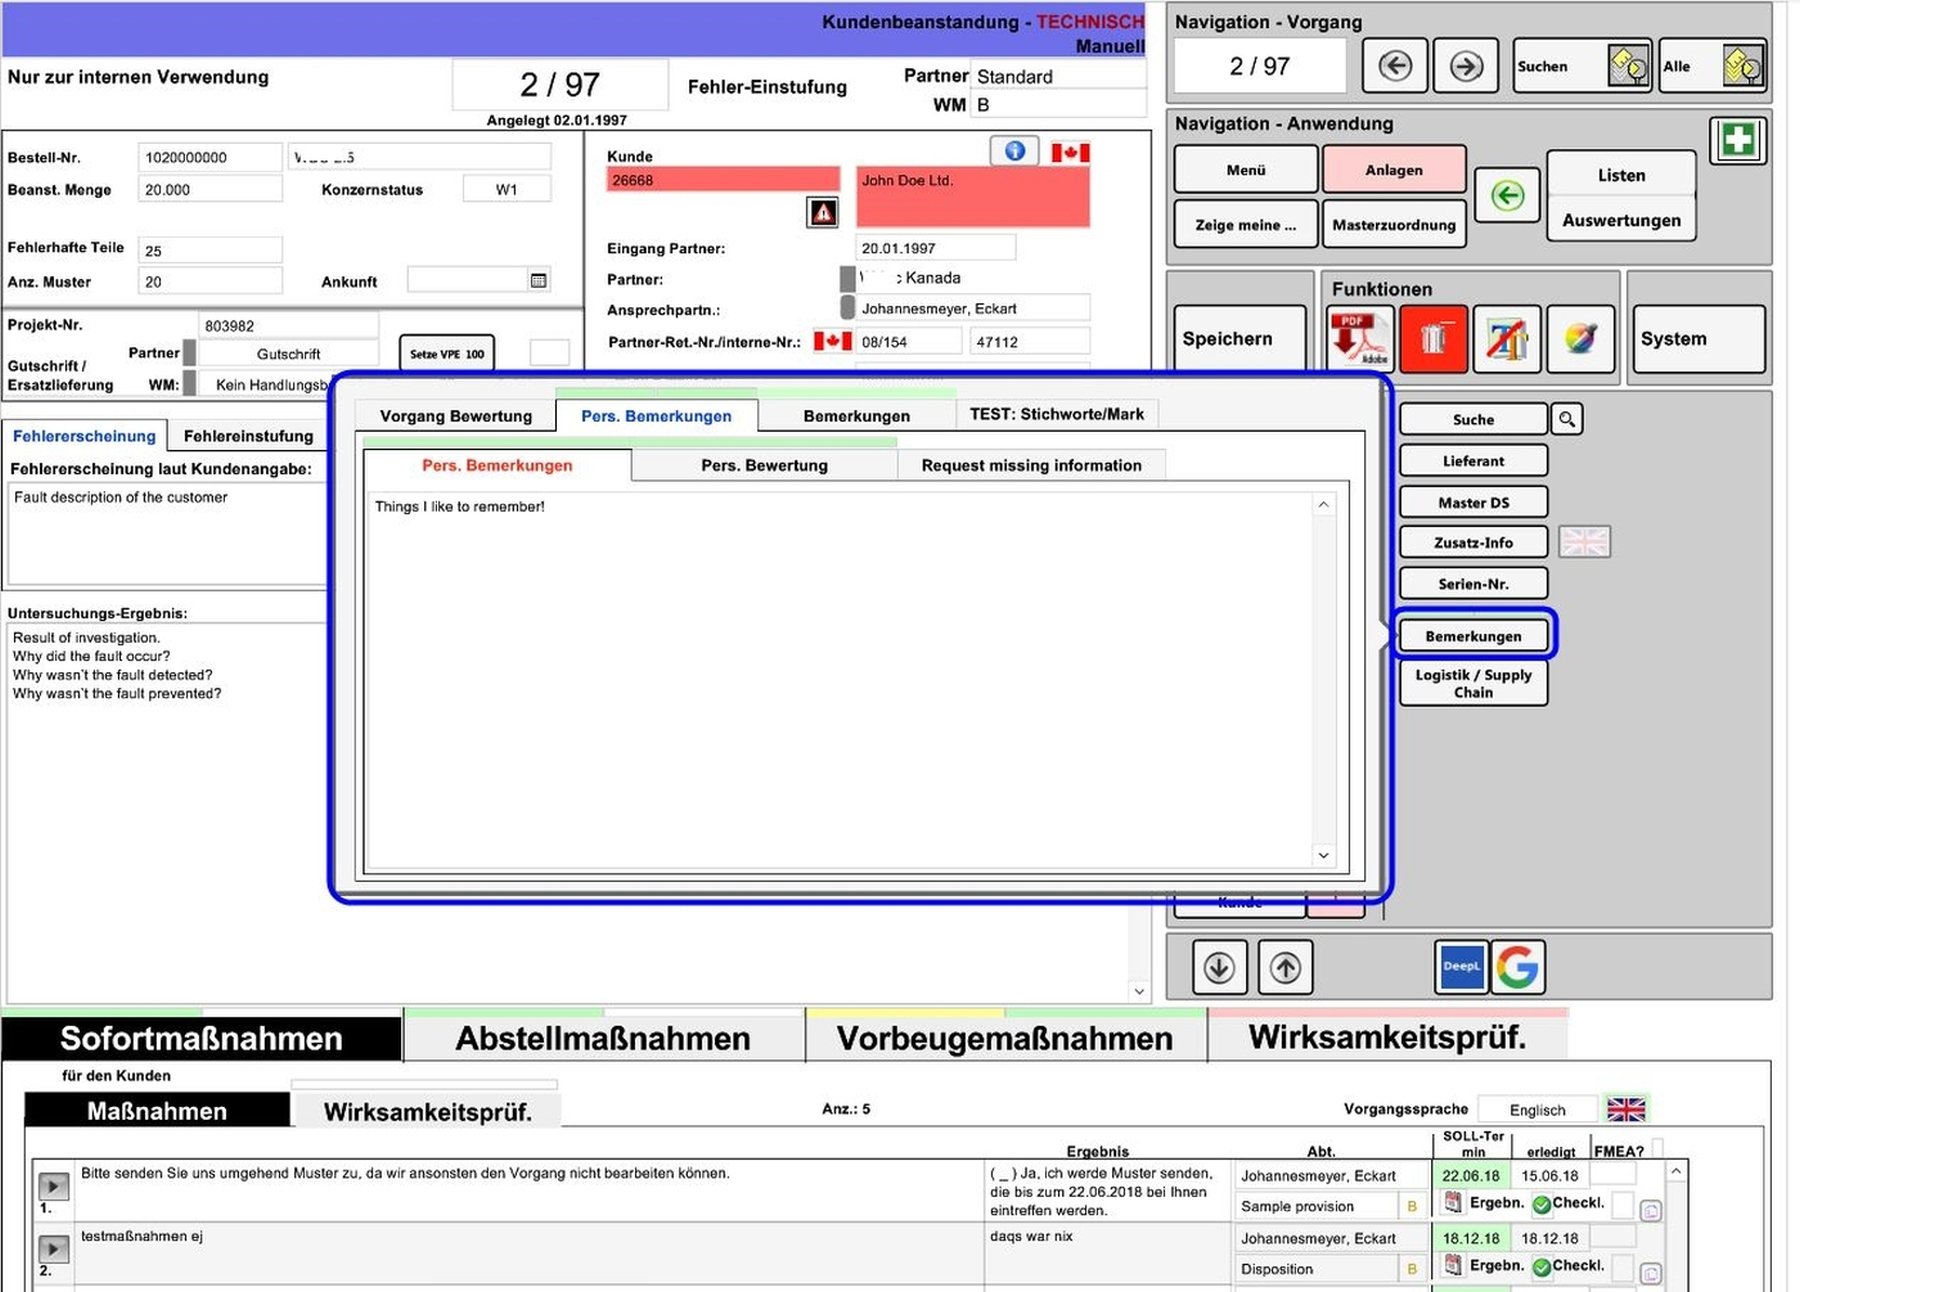
Some of the buttons open detailed views in which certain information can also be maintained. In this case, these are general comments on the task, which can also be viewed by other users. The tab with red text contains personal comments that are ONLY visible to the current user.
Here is information on the processing status of the external logistics service provider

Reference to affected quality management agreements
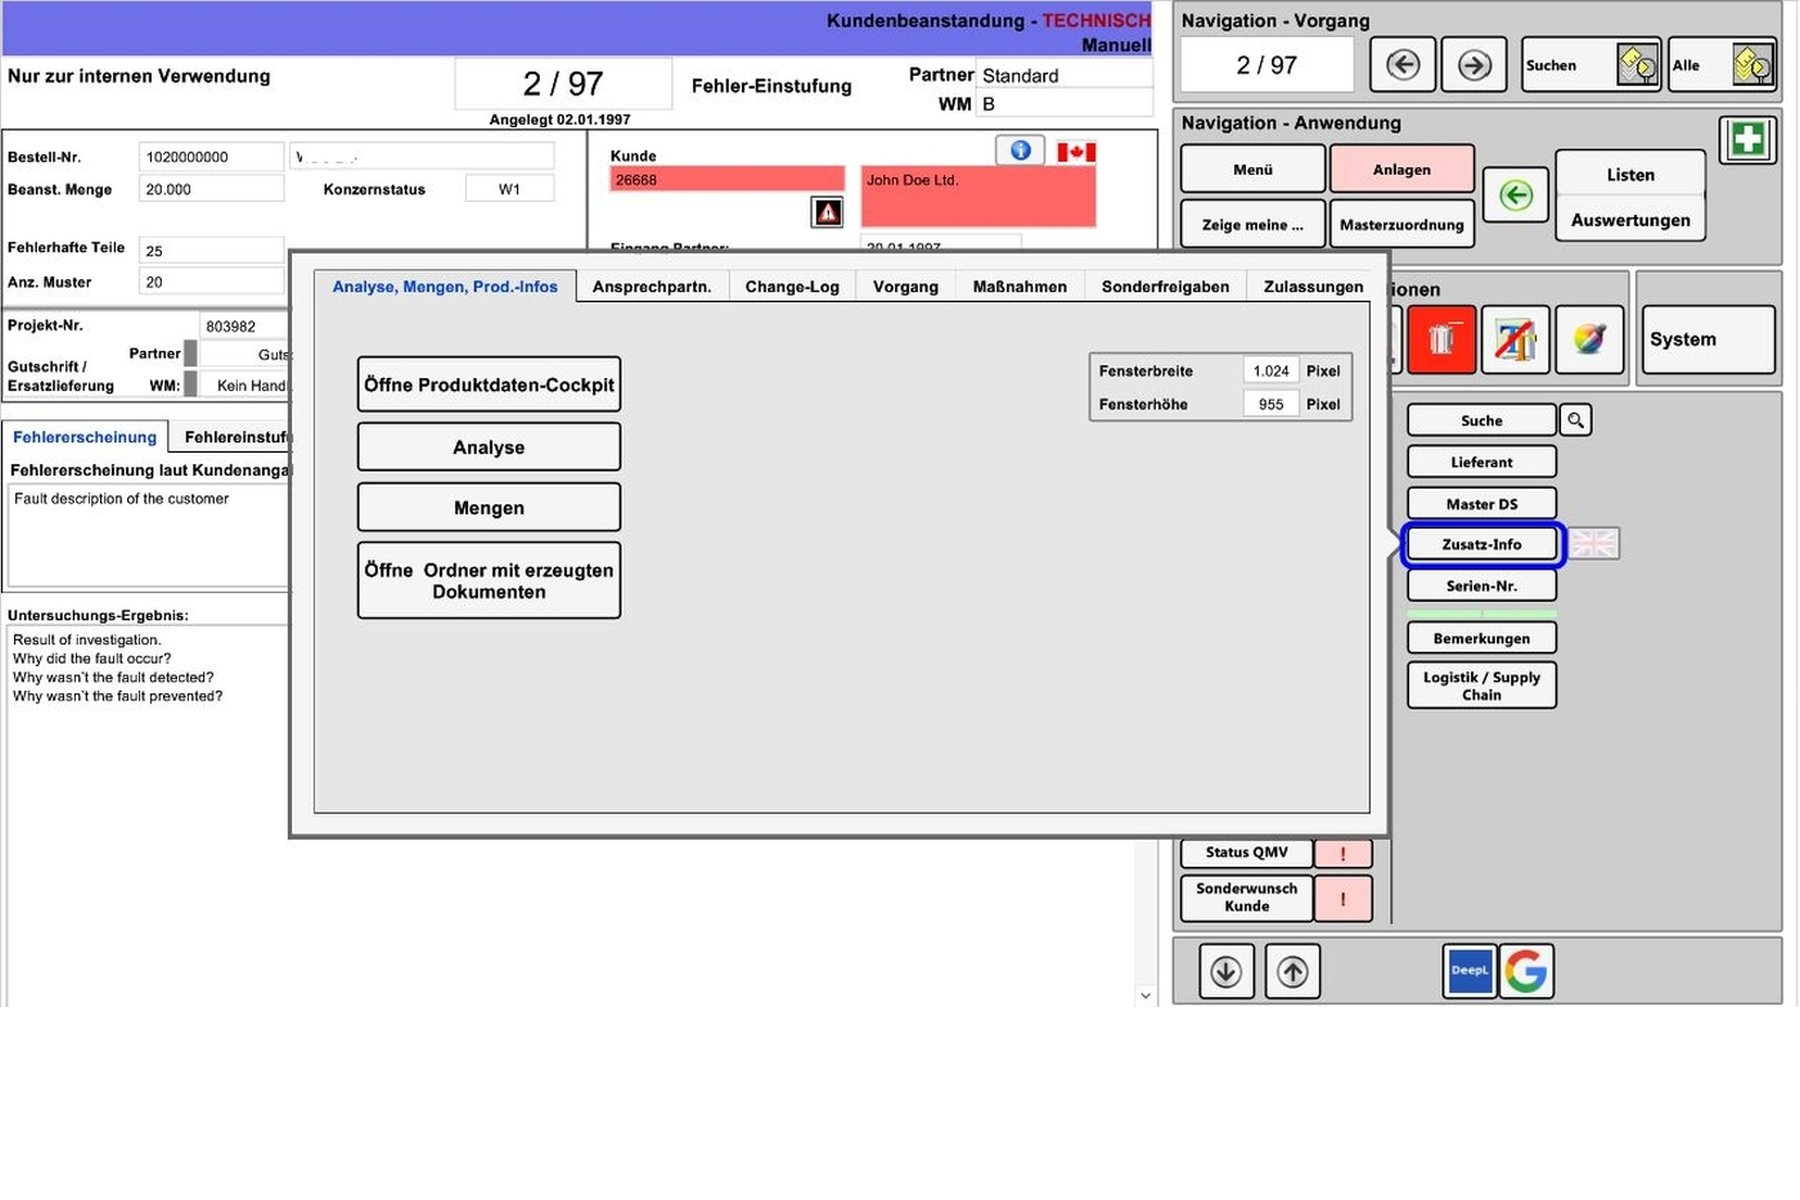
- Access to the product data cockpit on the intranet - Display of stock quantities as well as sales and turnover figures - and more

List of Quality departments and contacts

Change-log to important and controlled fields
Overview of the information provided to the customer
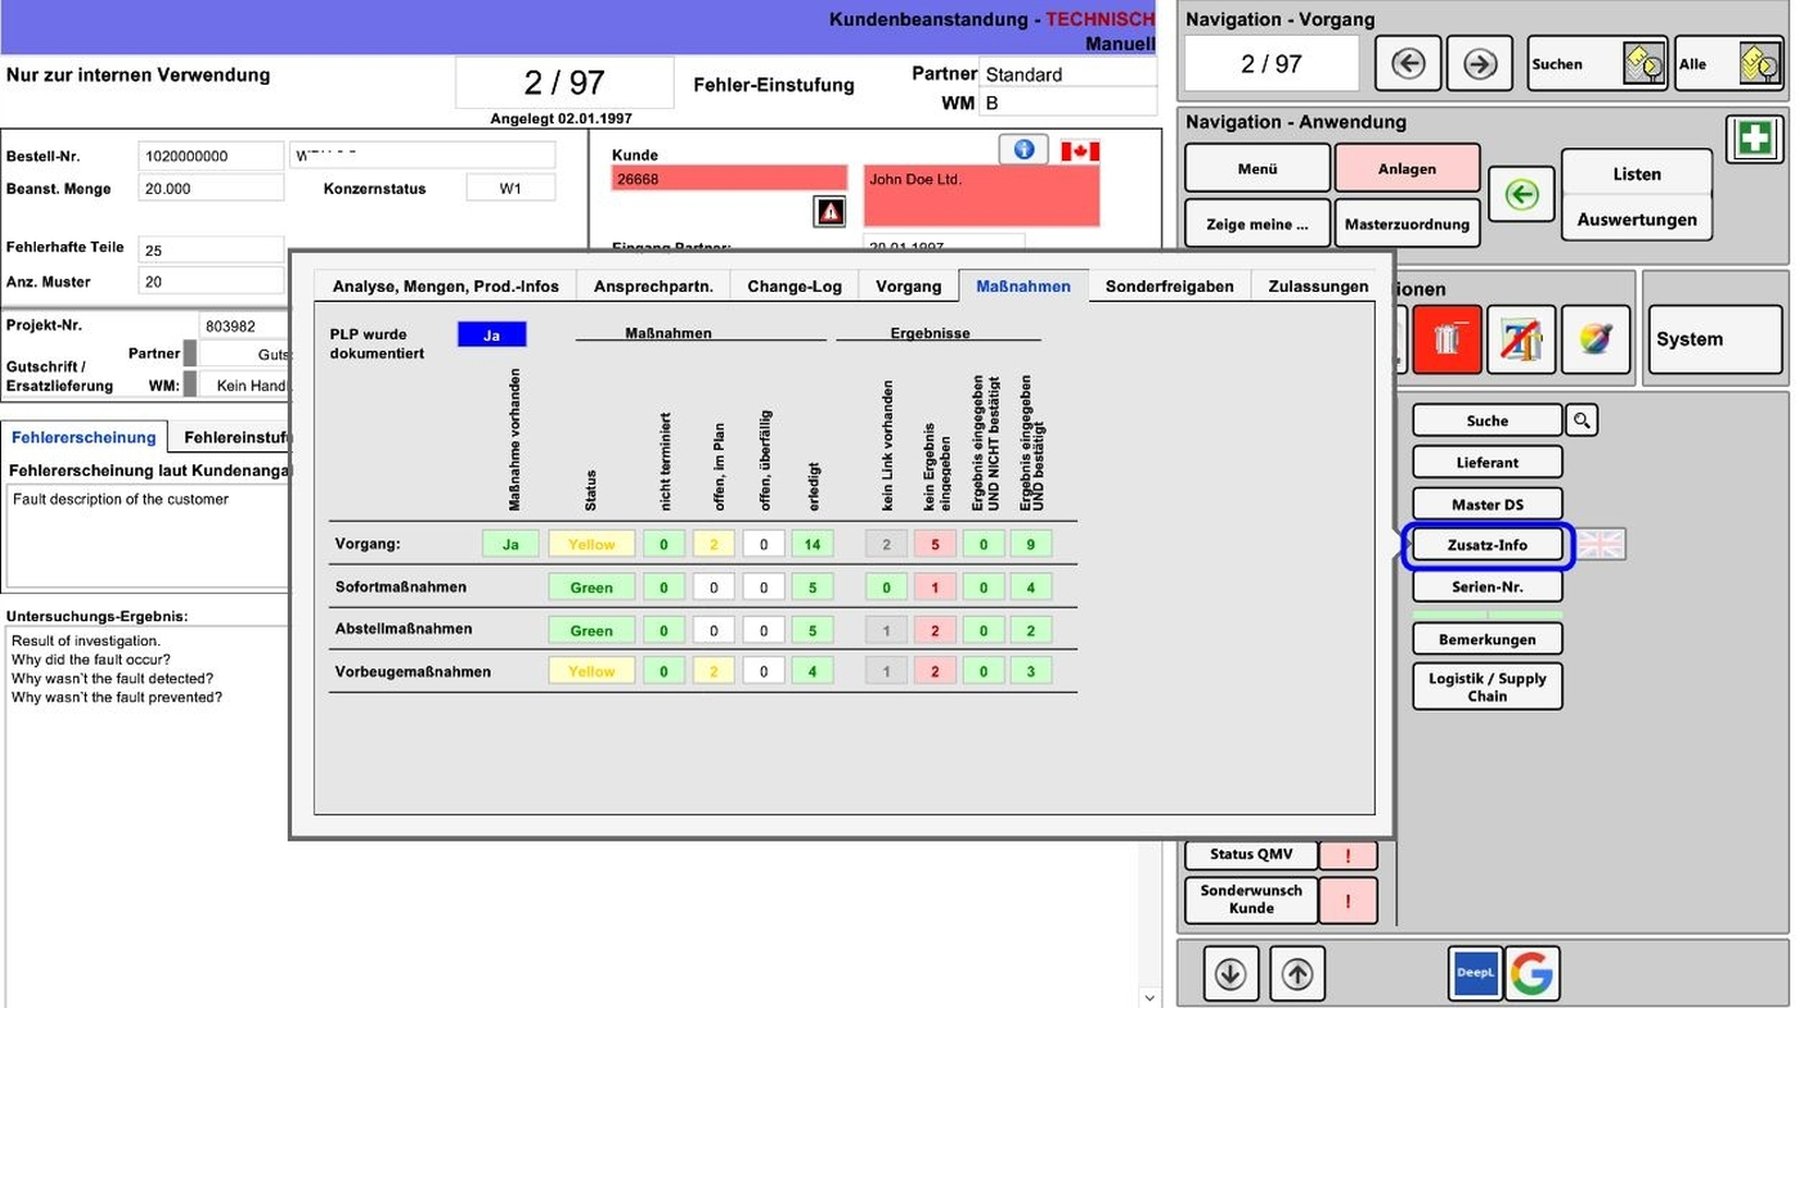
Status overview of all measures
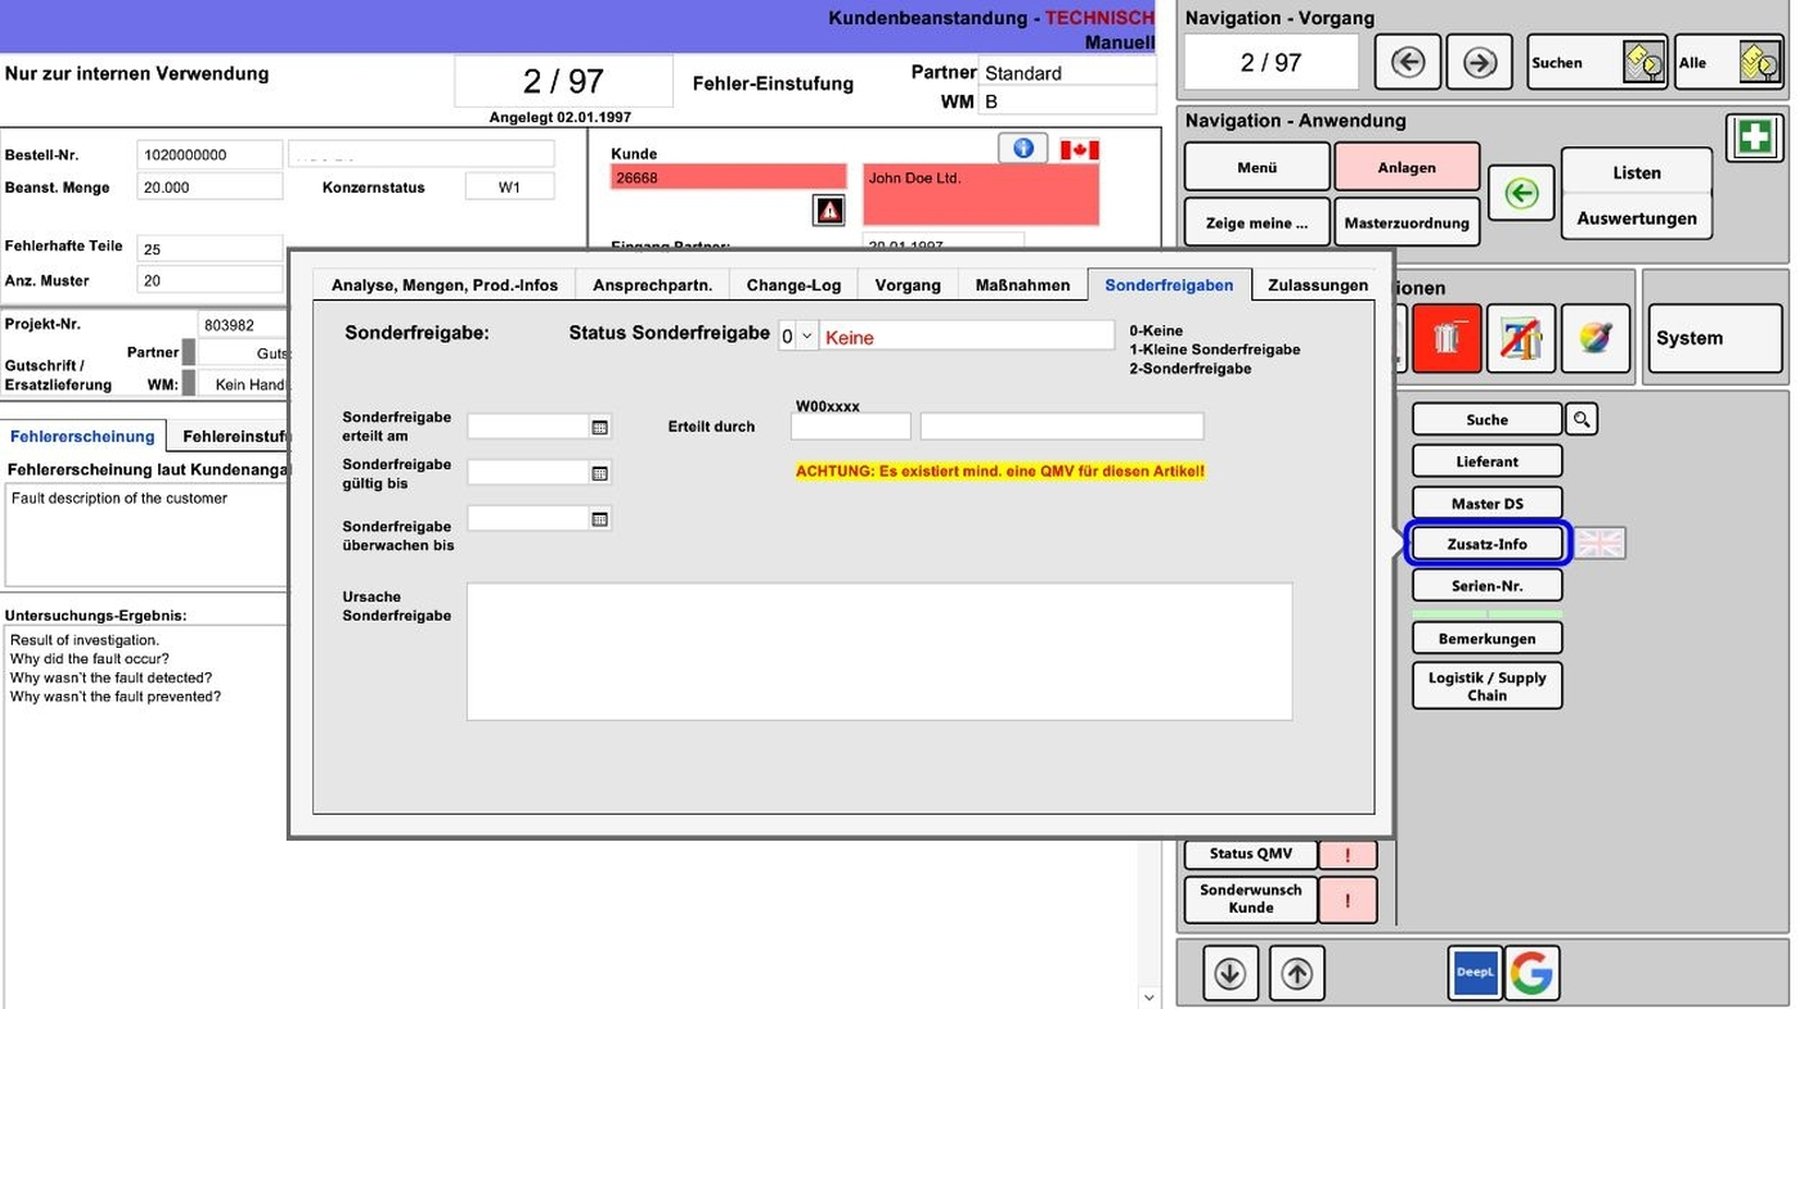
Particularly relevant for error messages and internal complaints, i.e. errors during the production process: Special authorizations
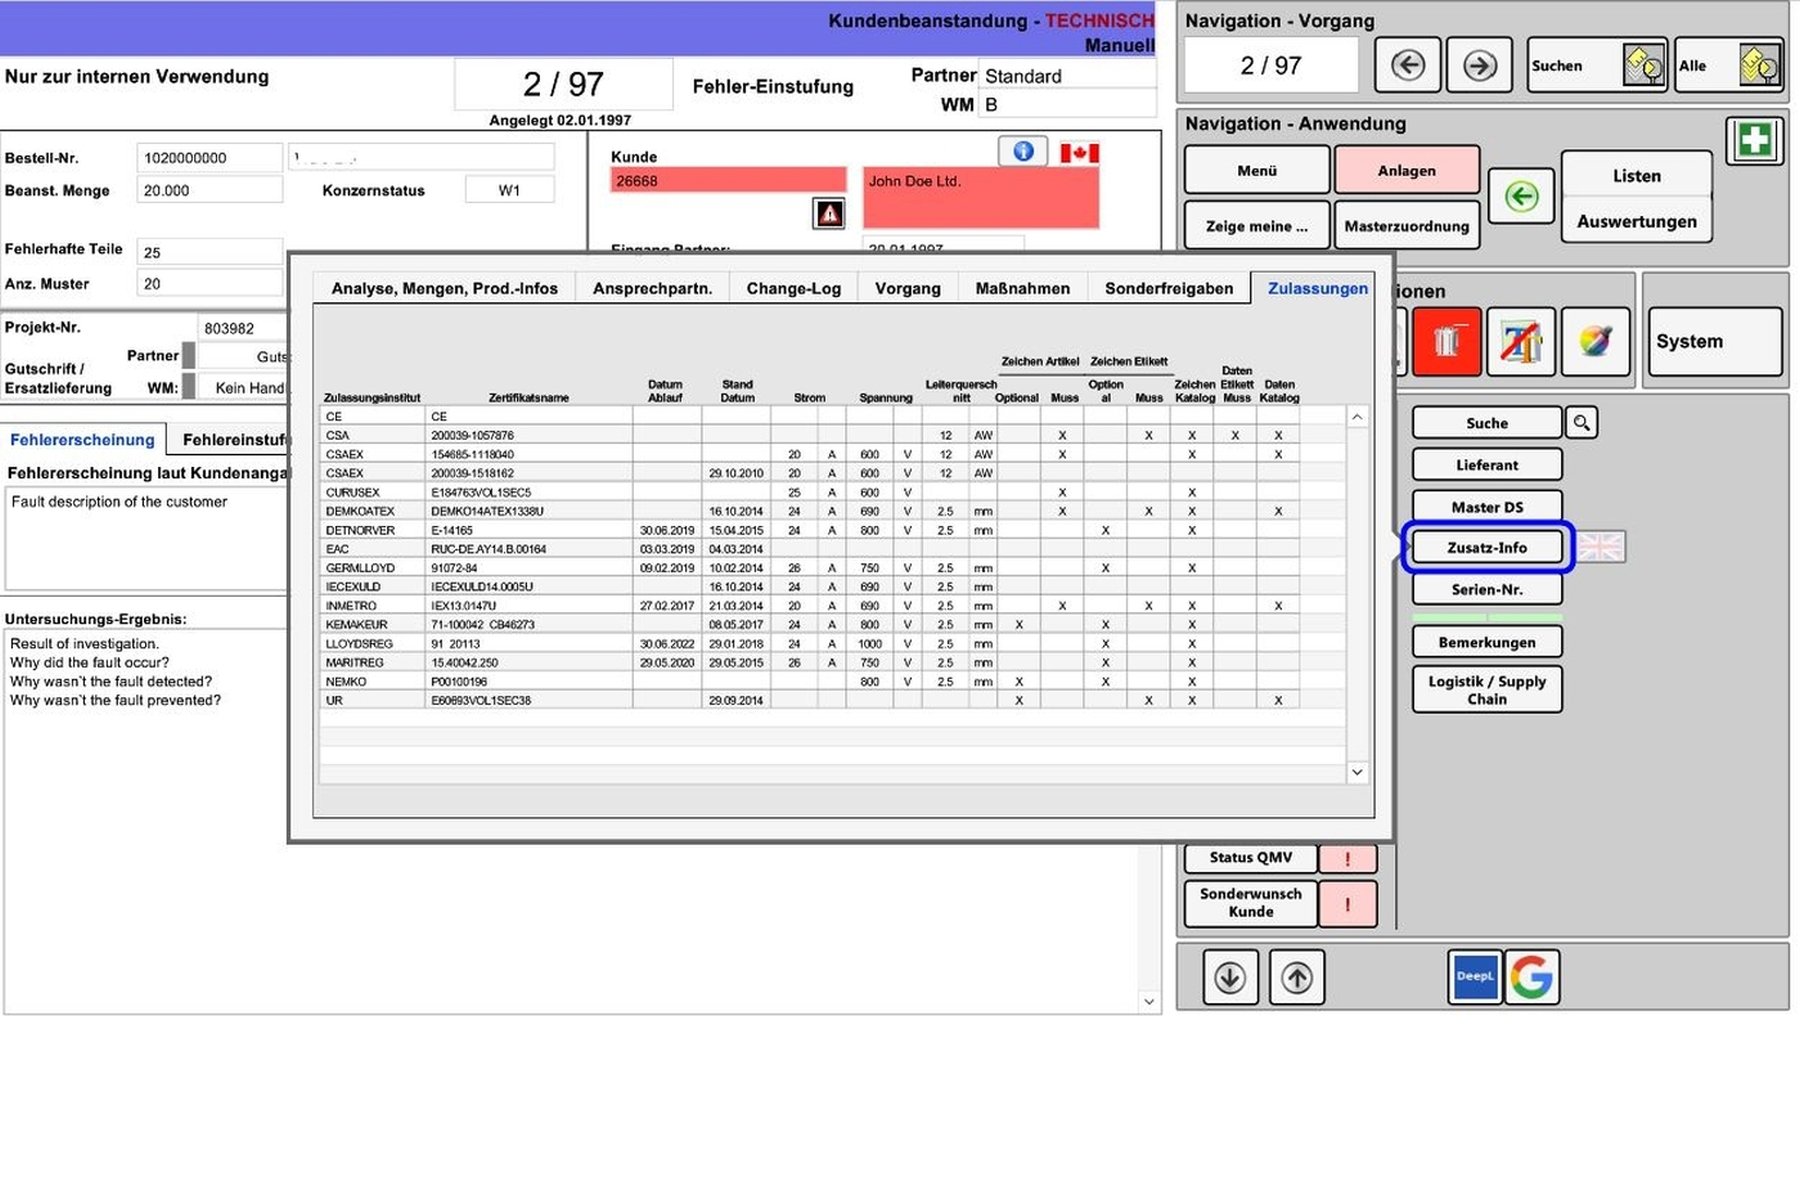
Overview of the approvals for the faulty article. This can be very relevant with regard to risk assessment.
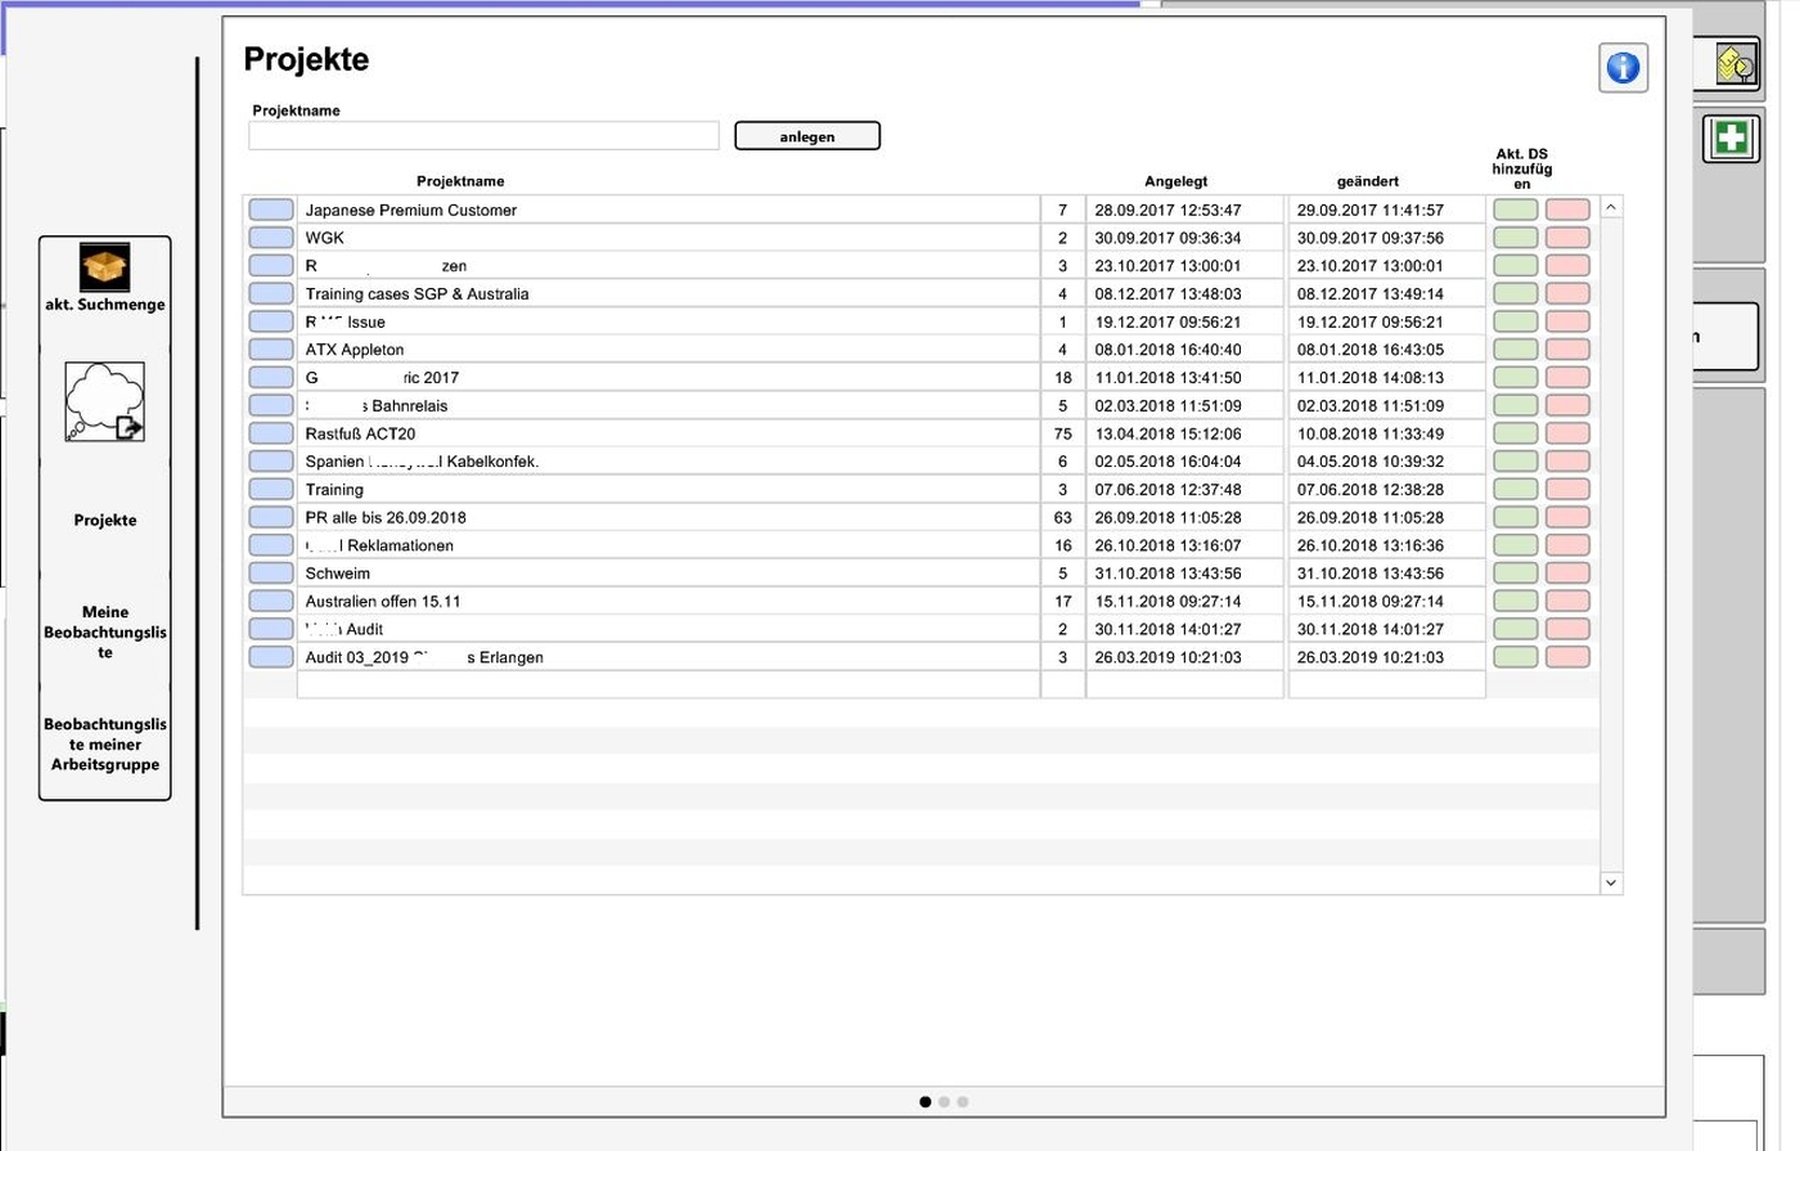
Here, users can summarize any tasks thematically and then call them all up again immediately with a click. This is particularly helpful if the tasks for a topic cannot be found using the same search queries.
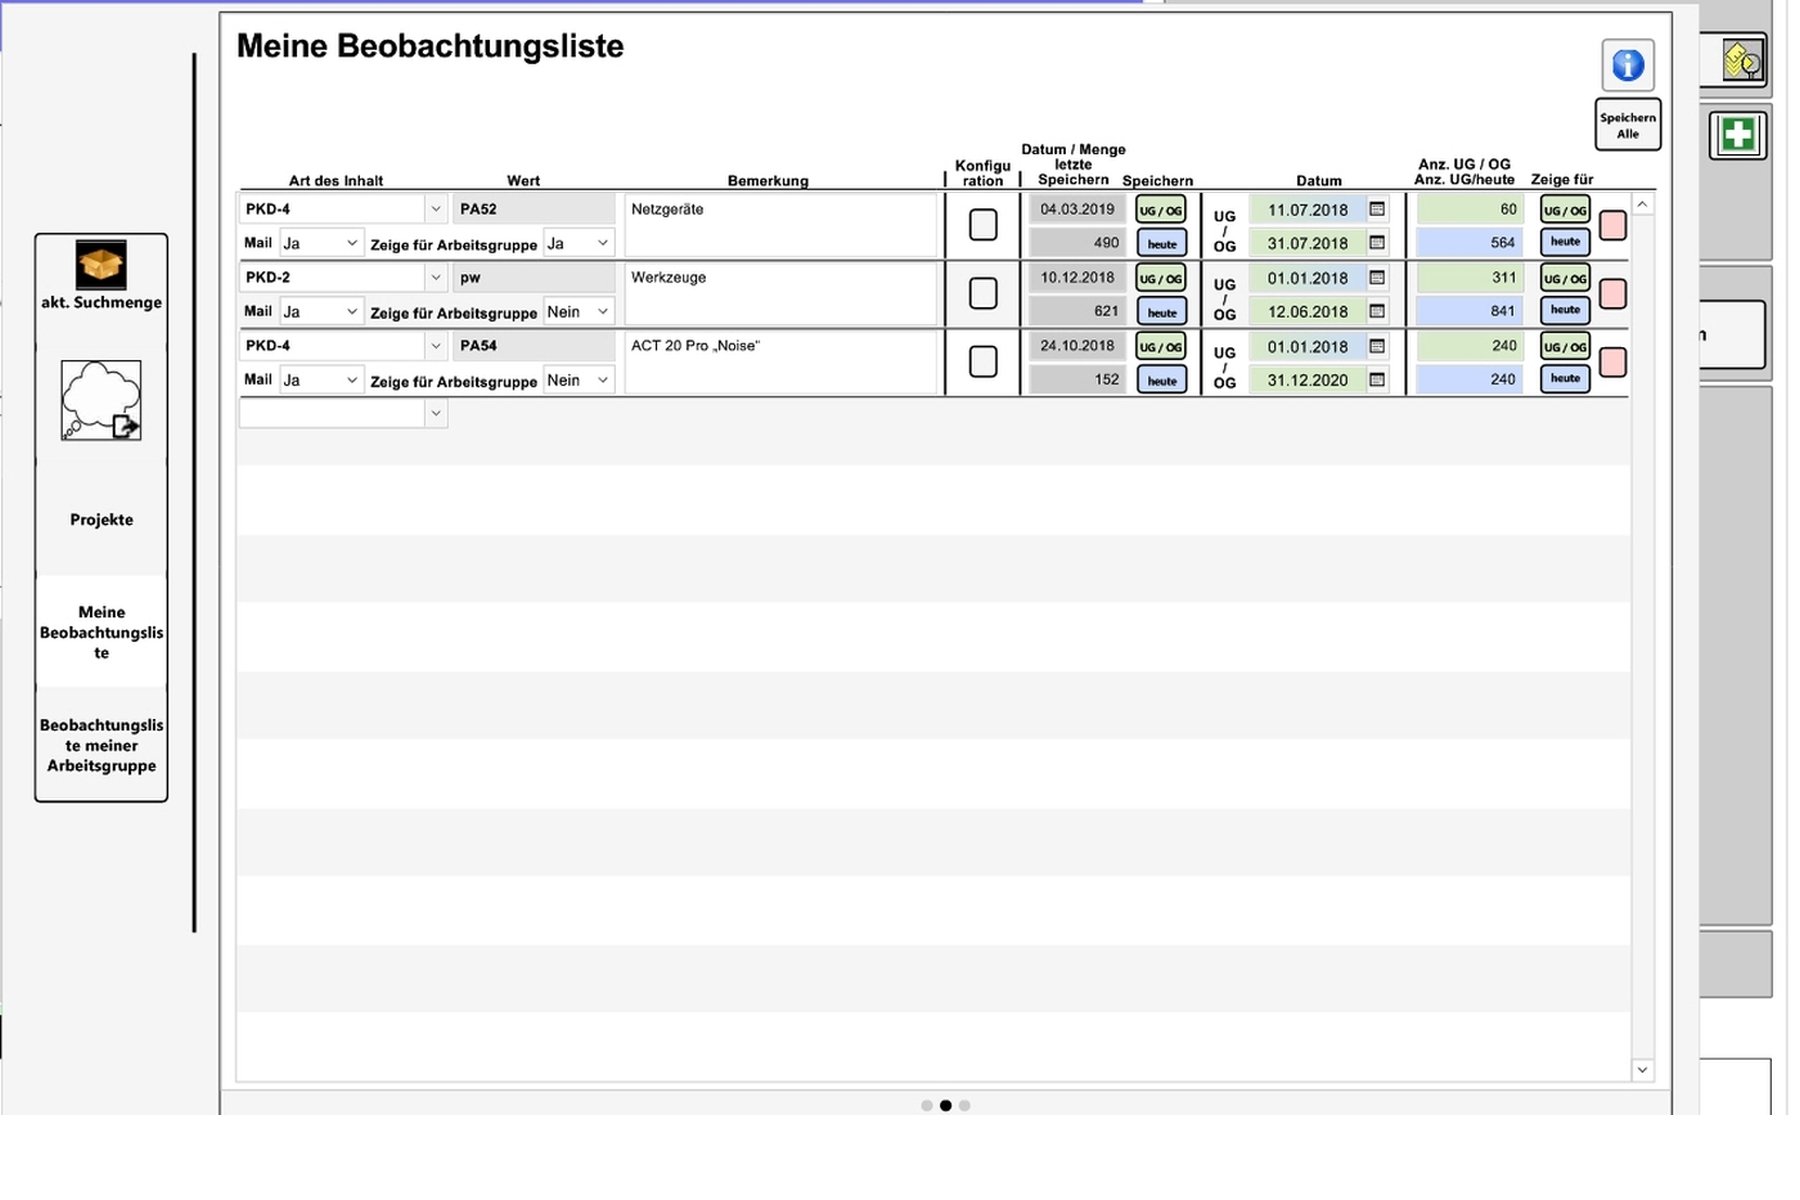
Observation groups can be defined here based on master data, e.g. items with a specific product code. You can then immediately compare whether new tasks have been added since the last observation point that the user was not aware of, as they may have shown a different error pattern.
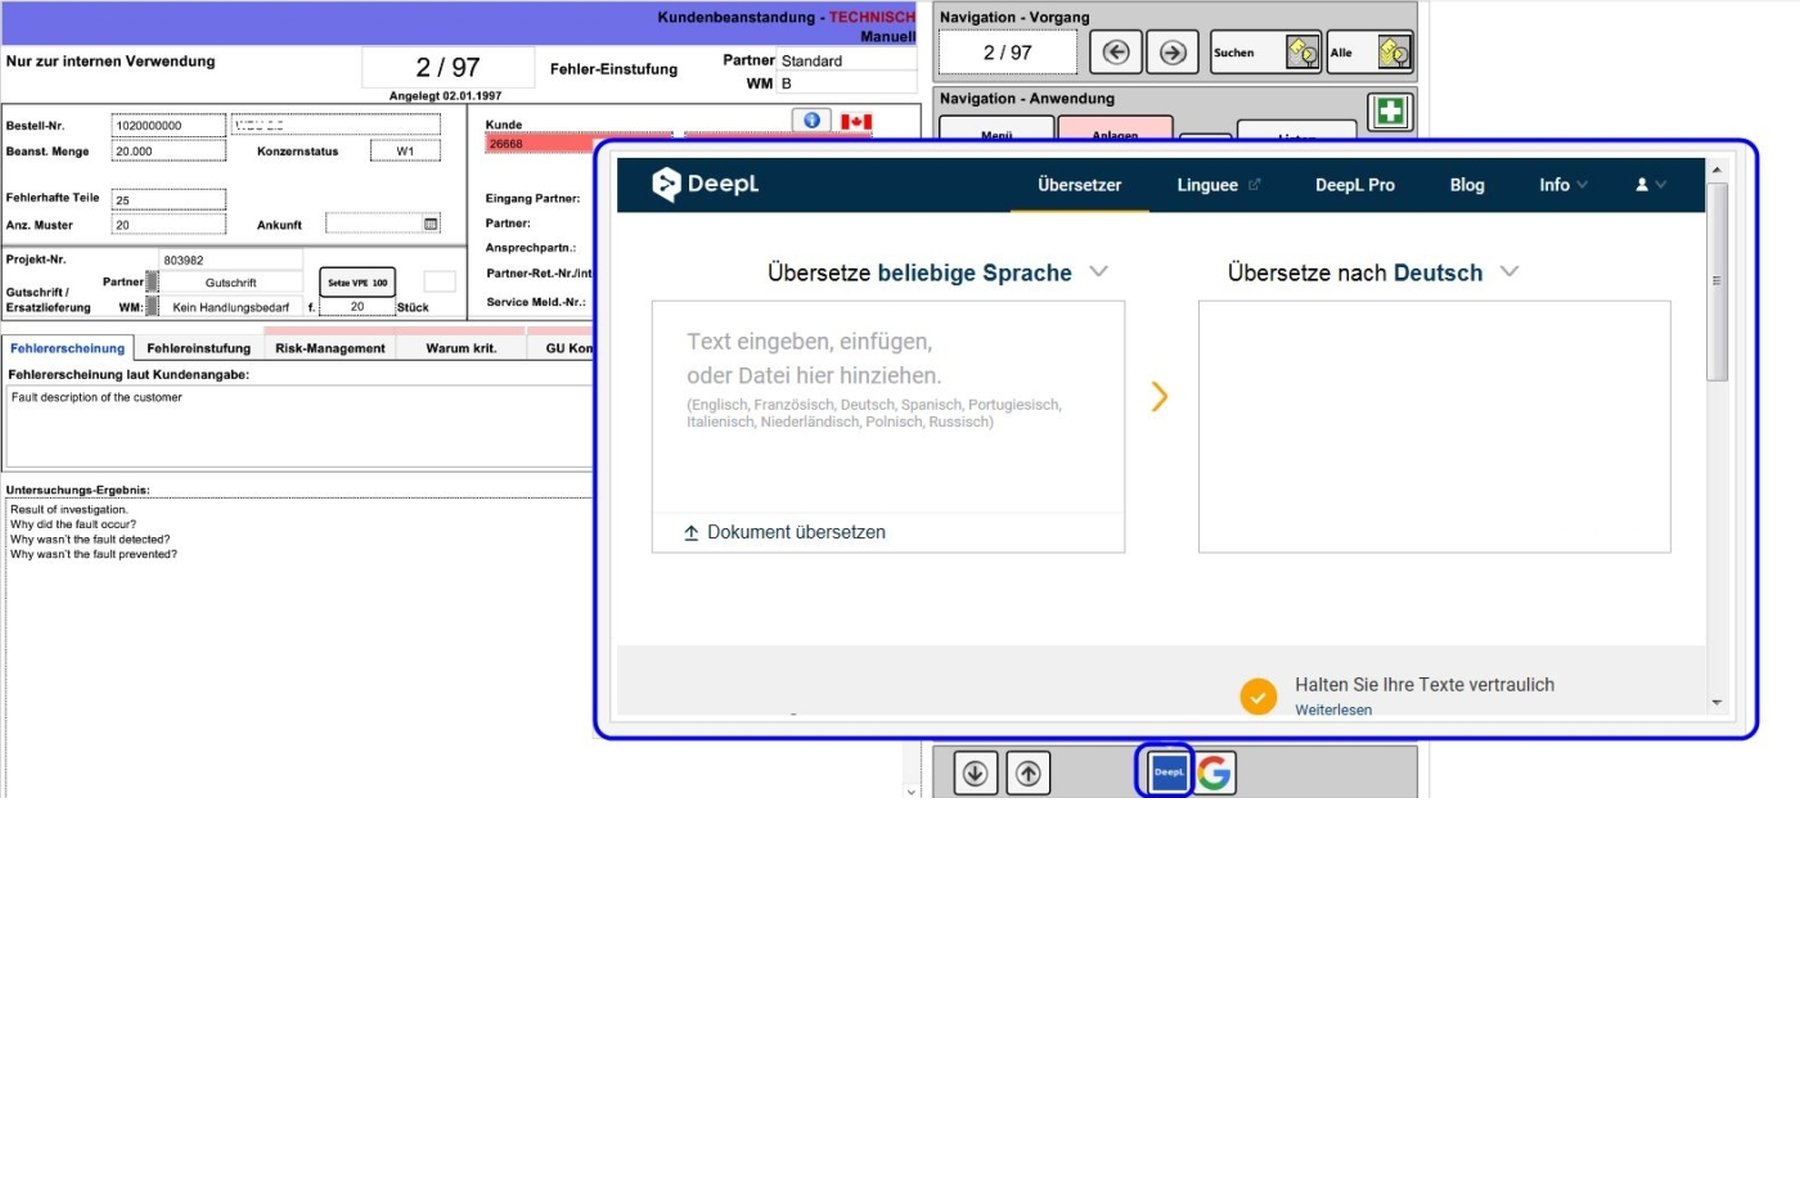
A simple and free translation aid has been included here. API integration was not requested.
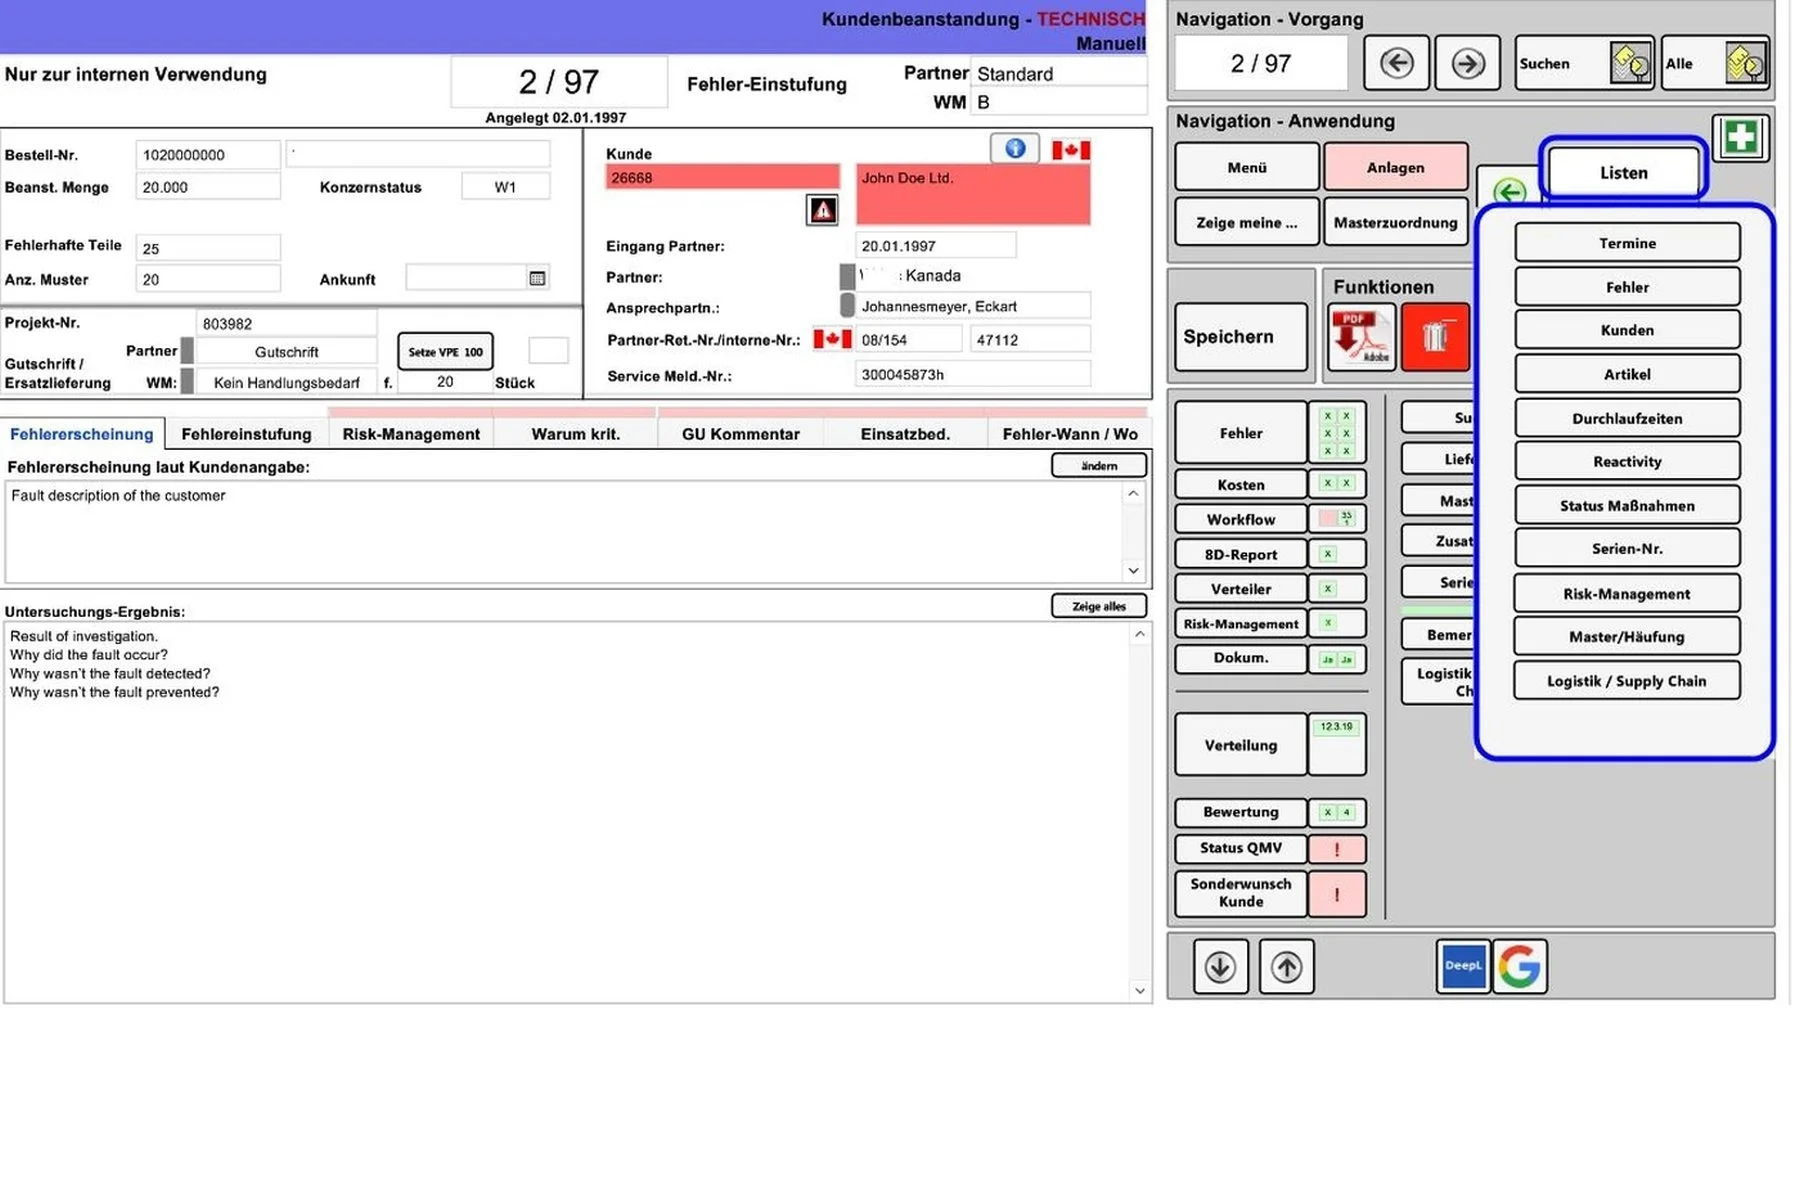
Navigation to all kind of list-views 1
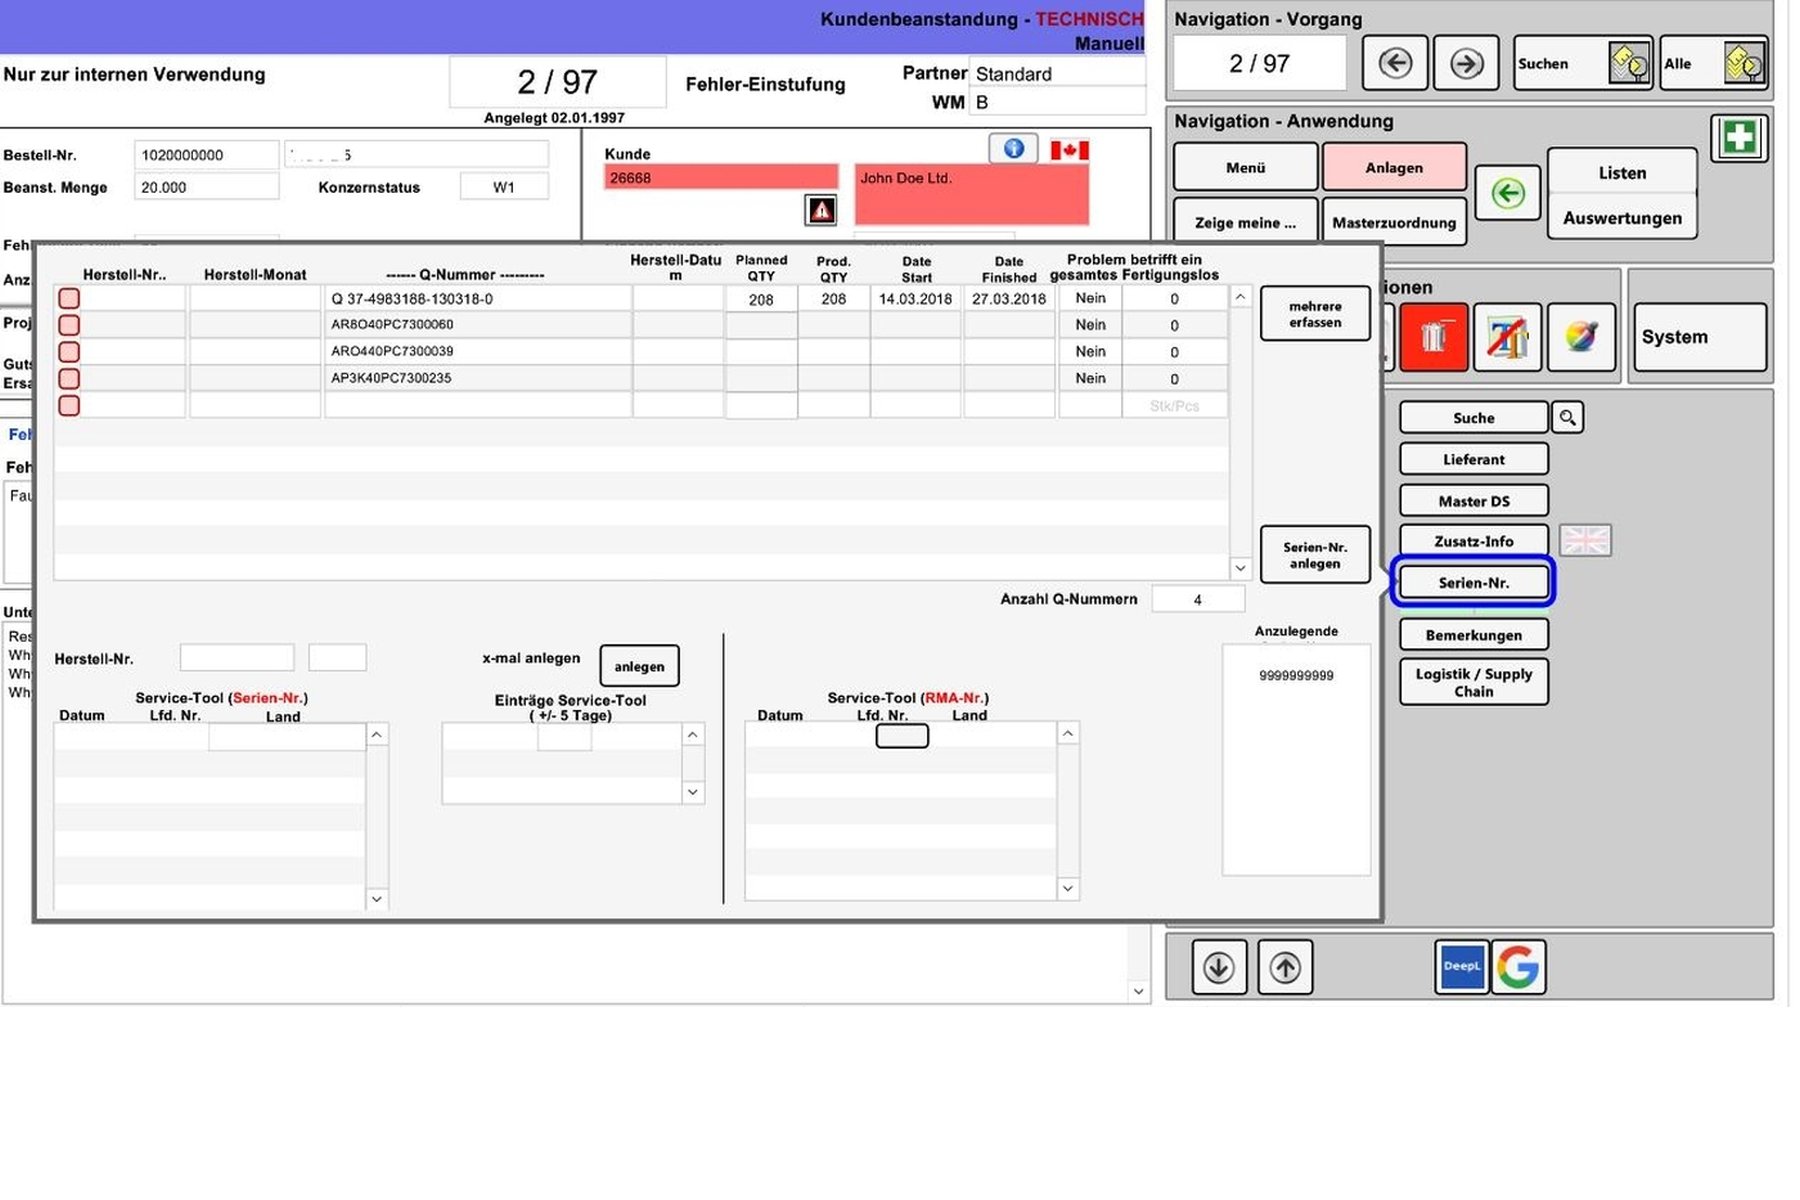
In the event that a faulty article was subject to the serial number obligation, the serial numbers could be recorded here for each faulty article

This feature was a great time-saver: if faulty parts were delivered to 20 different customers, for example, the first feedback from the market was used to carry out an in-depth investigation of the fault. For the subsequent complaints, the 19 following tasks were assigned to this "master" task and all problem-related content would be transferred so that processing could be completed immediately and the customer could be informed.
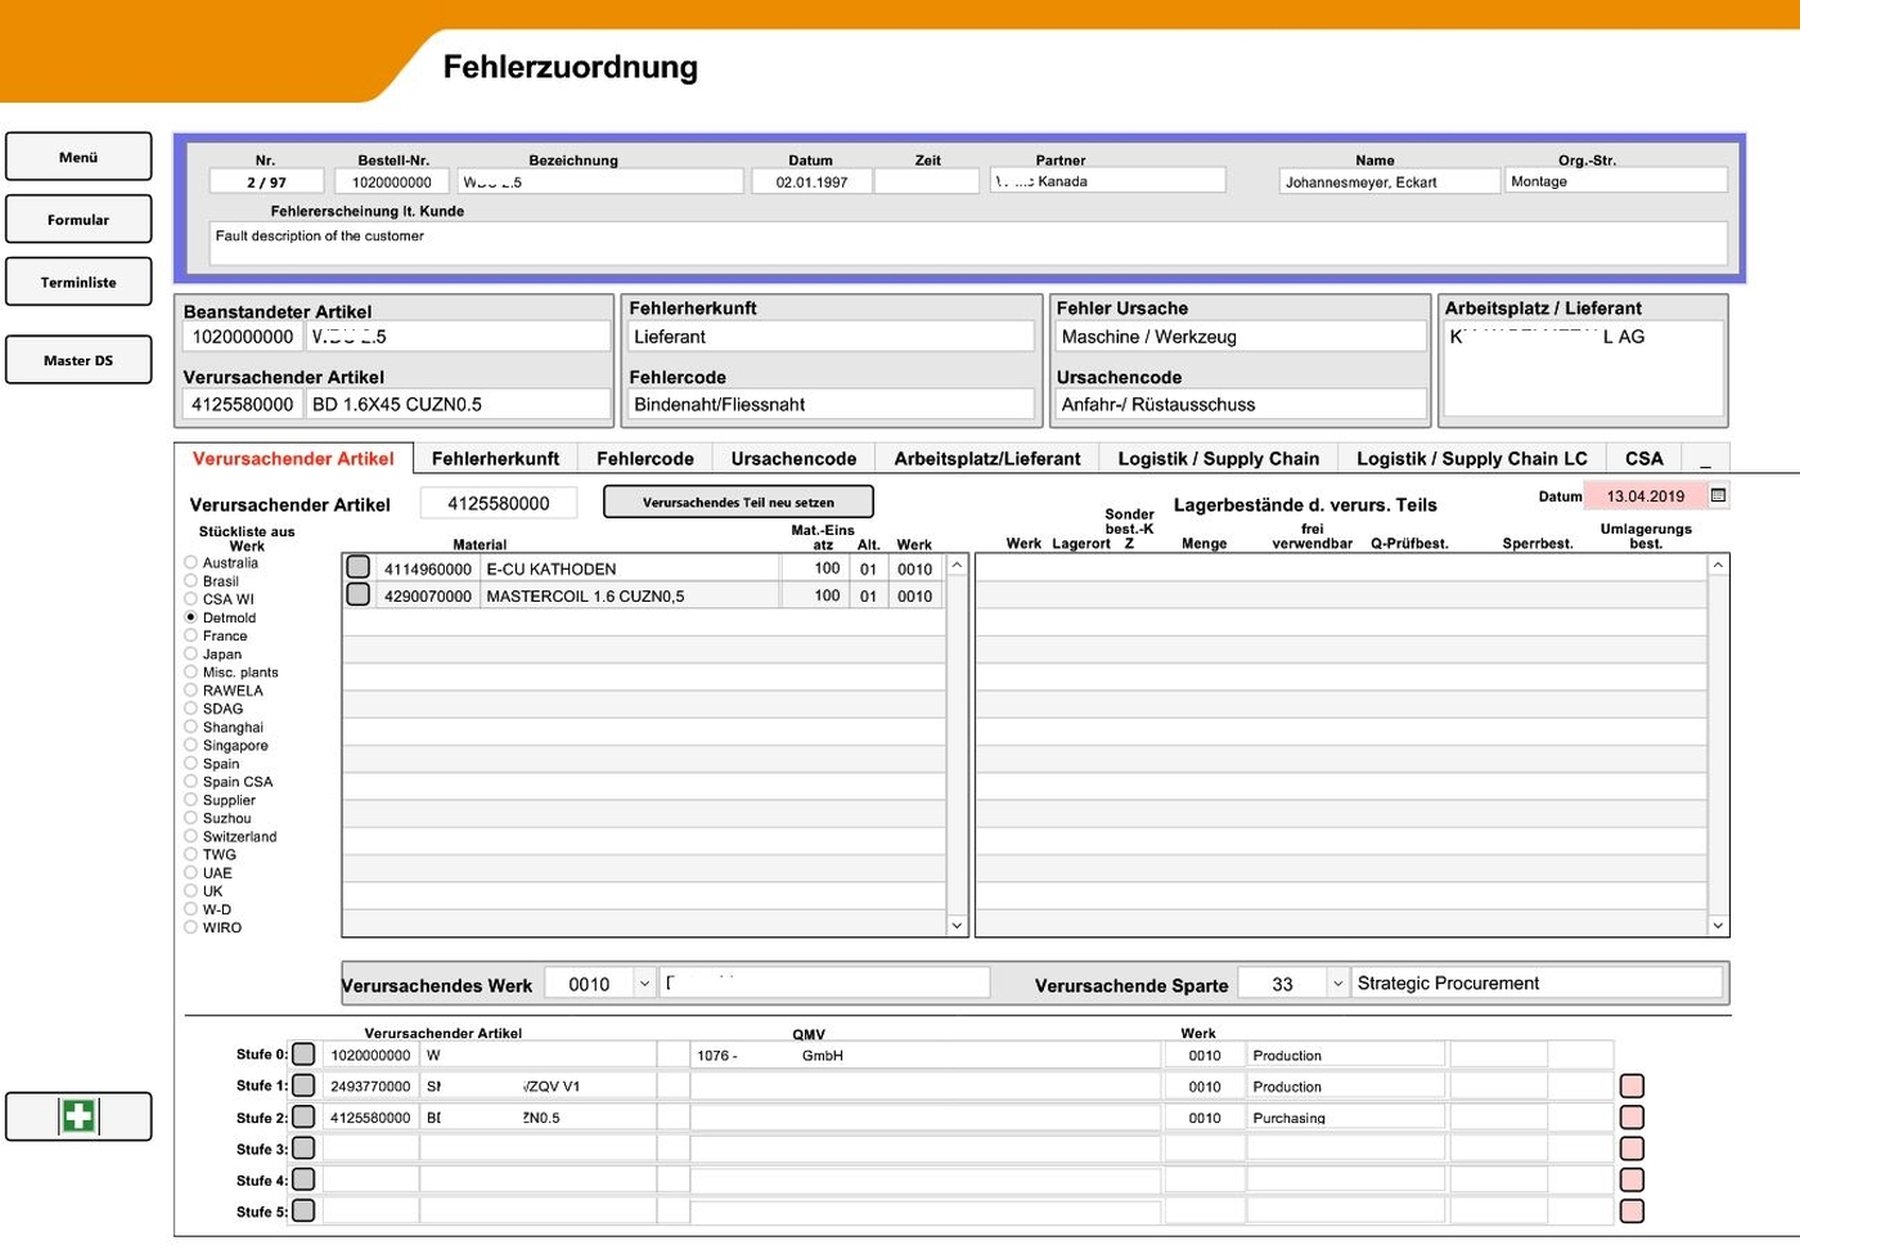
The error classification consists of several steps. There is a separate tab for each one. First, a possible component is selected along the BOM hierarchy that is mainly responsible for the error. BOMs in other plants can also be included. The report-relevant fields are also filled accordingly with the selected item. The selected hierarchy of the articles causing the error is displayed at the bottom. Translated with www.DeepL.com/Translator (free version)
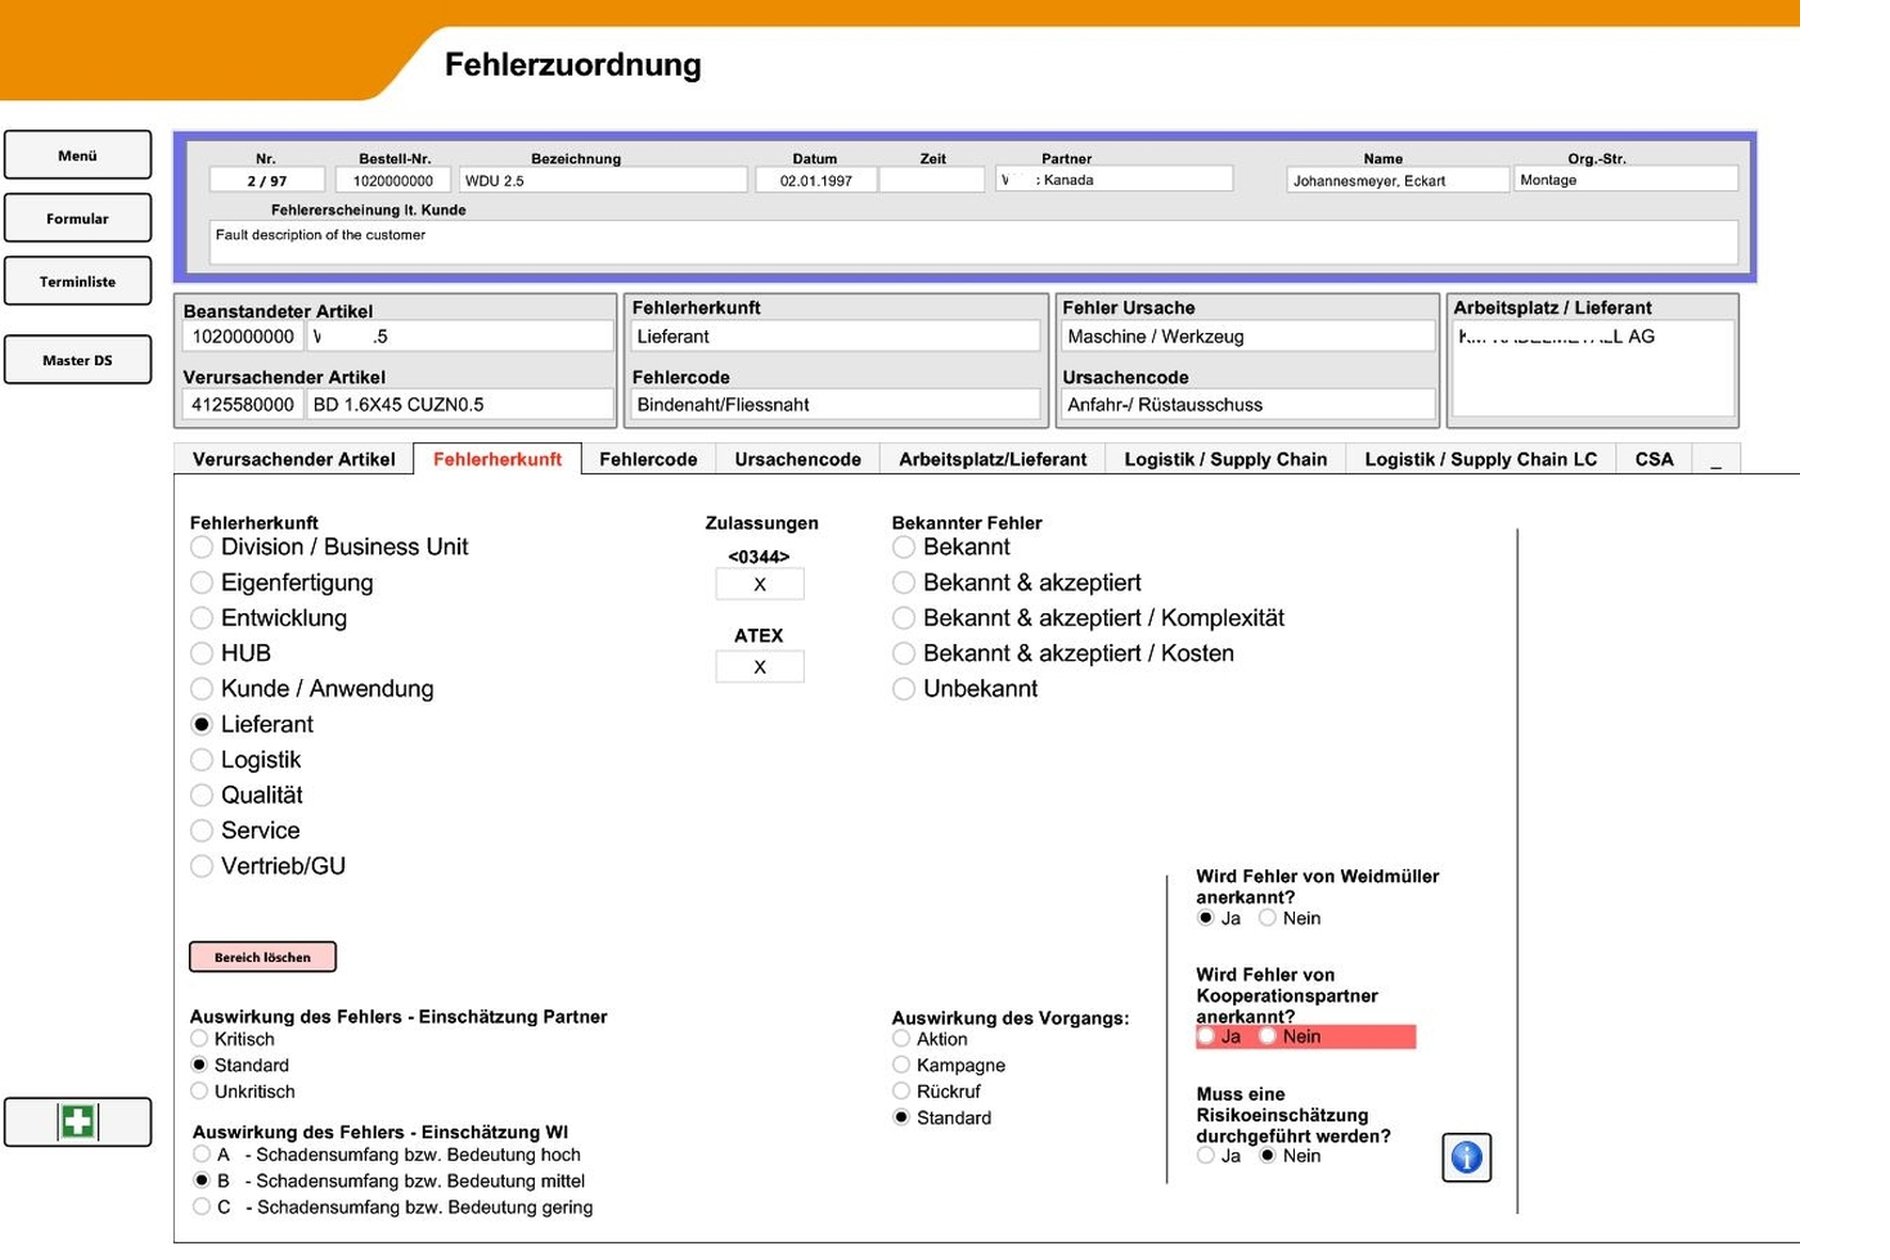
Next comes - the assignment to the originating organizational unit - the criticality of the error - the impact of the error - the handling of the error on the market with documentation as to whether a risk assessment is necessary

Fault code
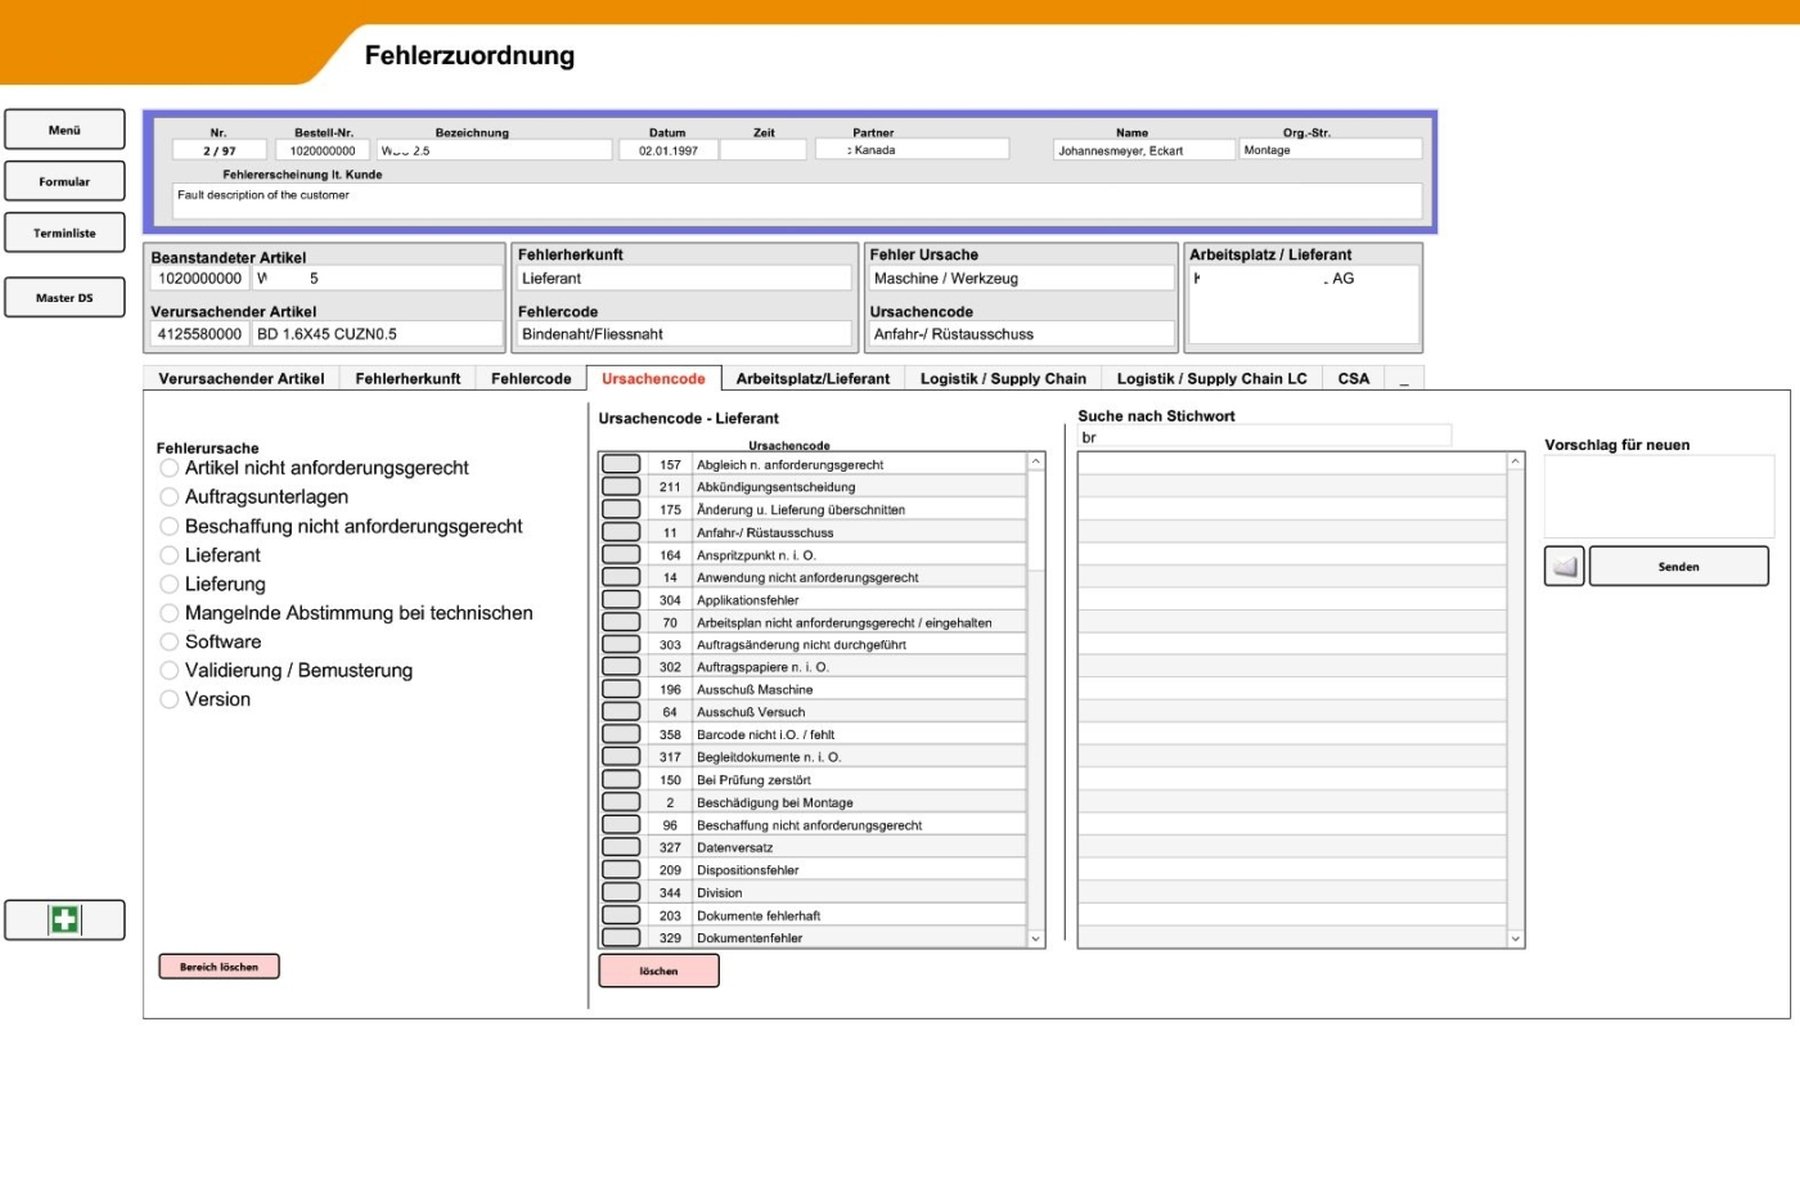
Code of fault-reason

Assignment of work center or supplier where the error was caused

Supplier

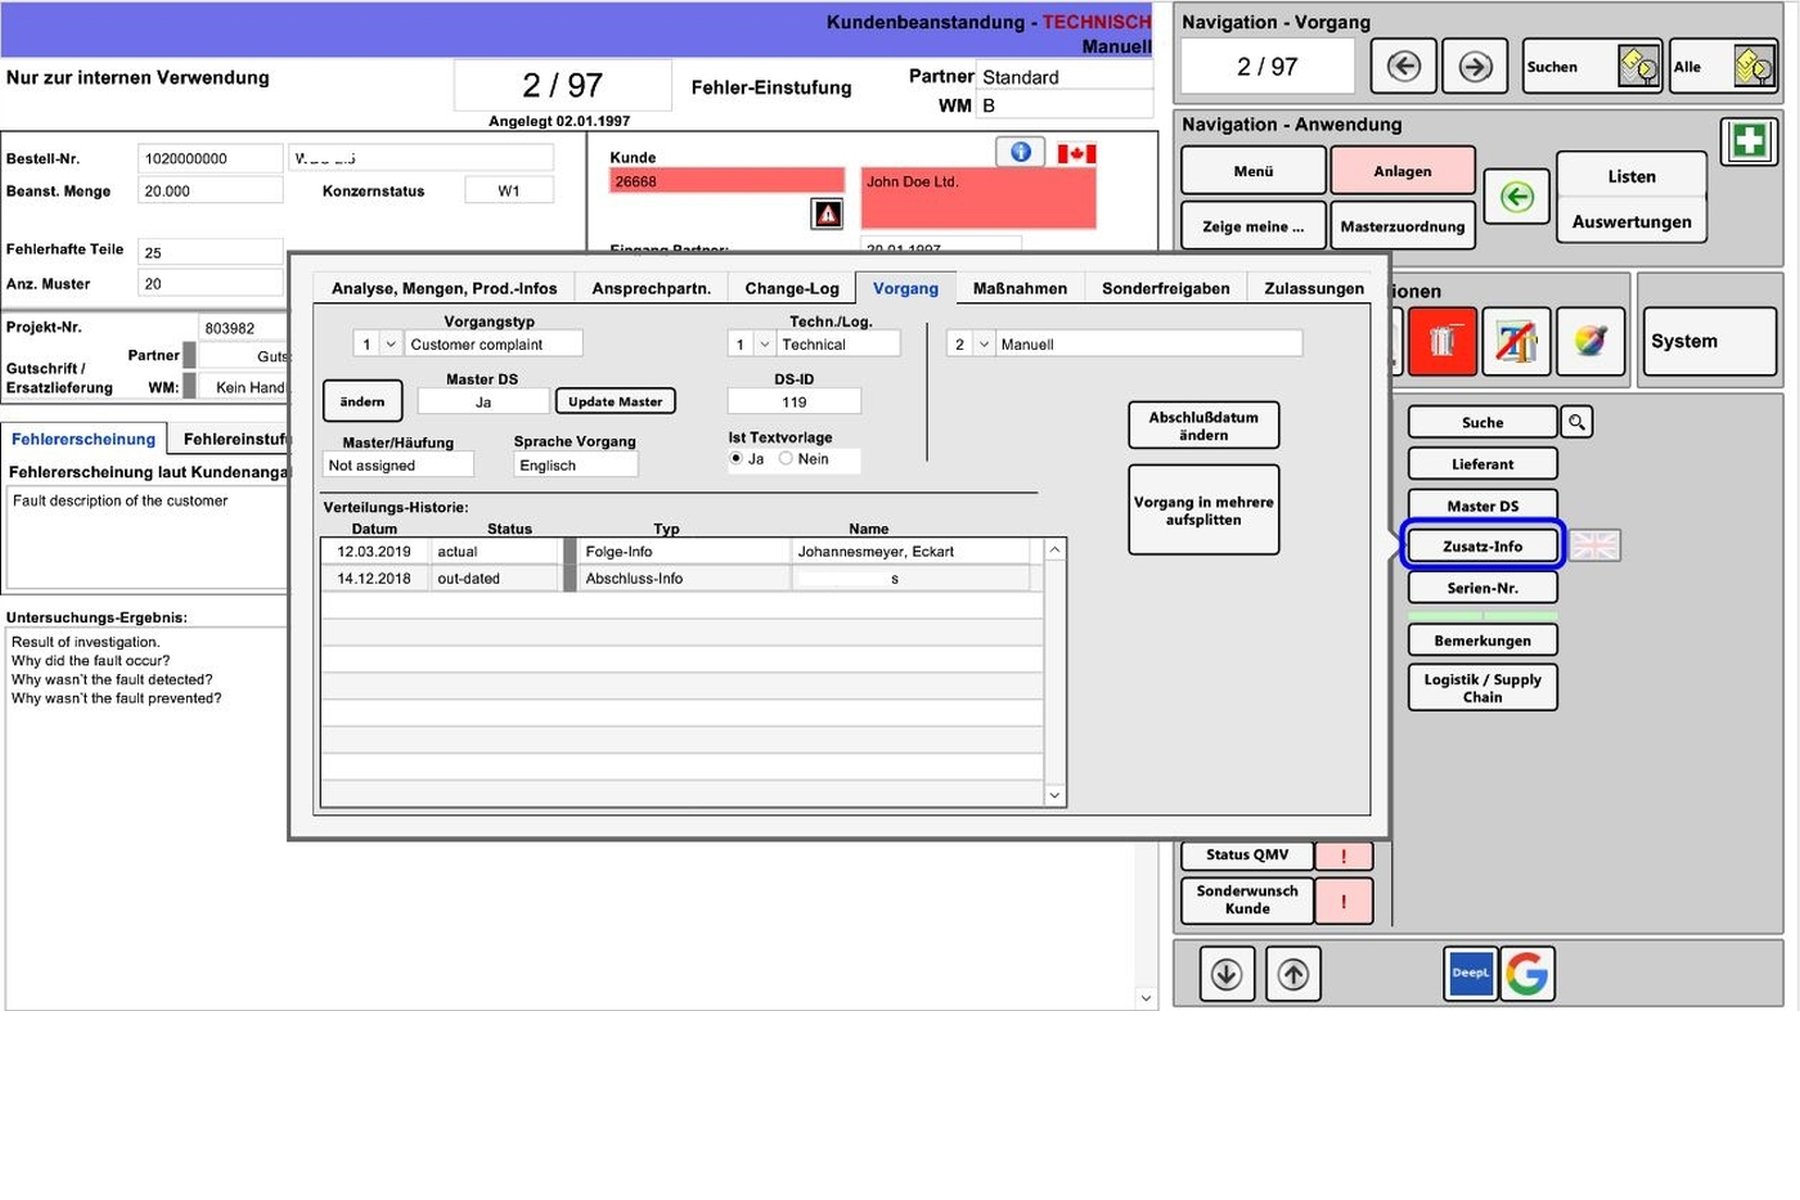
The processing flow of the task is shown here. In the area on the right, colleagues in different plants could be searched for and assigned to the next review. In the case of customer complaints, only the complaints manager could assign other people and was assigned the process again after each processing step.

Grayed out persons have no user for the system.

The e-mail distribution list can be configured here. Some recipients are automatically added to the distribution list for each task: - The creator of the task - In the case of critical or high-cost tasks, also the risk manager or executive management Each user can create any number of distribution groups for themselves and assign them or re-select from frequently used recipients
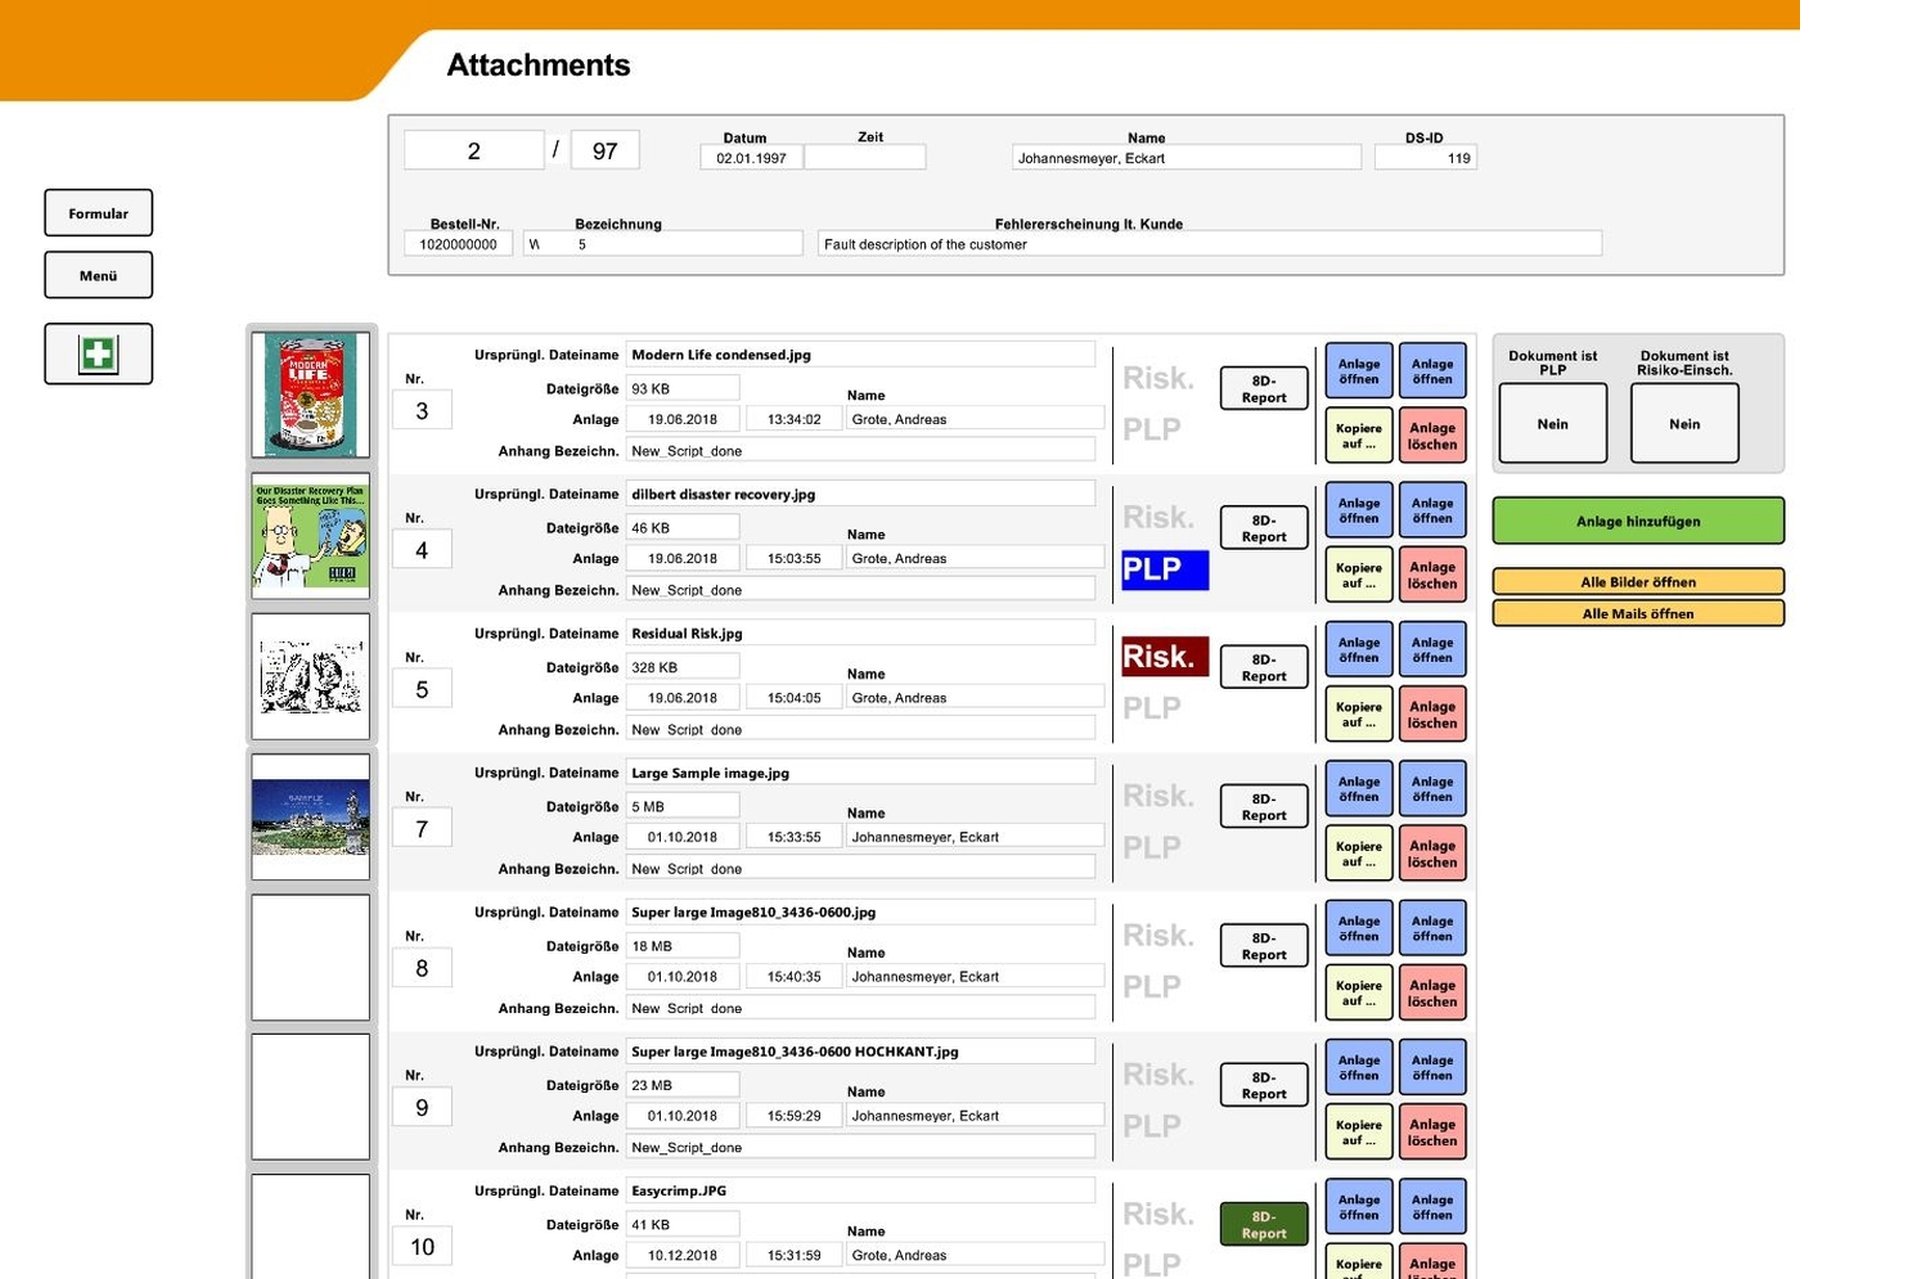
The attachments can be managed here. Two special document types can be marked as such and have an influence on the workflow of the task:

The Java-based ticket system for the logistics service provider is integrated here. The process data required for ticket generation is automatically inserted into the clipboard so that the user can immediately insert the content after opening the ticket. In addition, an Excel template was filled out with the task data in a defined folder, which could then be added to the ticket for further processing.
Here, the Excel template with the logistics service provider's information can be read in again and the data assigned to the task.
Due to the large number of options for editing measures and effectiveness checks, these were edited in a separate view. Action type, classification, creating and executing person, target date, actual date, postponements, reminders, printability and resubmission were maintained in this view.

The reminder dates for this measure are displayed here. The reminder system had an automatic escalation built in to achieve good error correction discipline.
The first dunning stage was carried out 100% by the system alone. If the target date was exceeded and the measure was still open, a reminder e-mail was sent to the person carrying out the measure. For an action in the first reminder level, the person carrying out the action then had 5 working days to postpone the action or report it as "completed". If it was still open, a reminder was sent to him and his superior in the second reminder stage with a further deadline of 2 working days. The third reminder stage was then sent to superiors up to management level. However, levels 2 & 3 were confirmed manually by the Head of Complaint Management in order to avoid unnecessary escalation in the event of illness, vacation, etc. For this purpose, the tasks were displayed to him as can be seen and he could deselect those that should not be admonished.
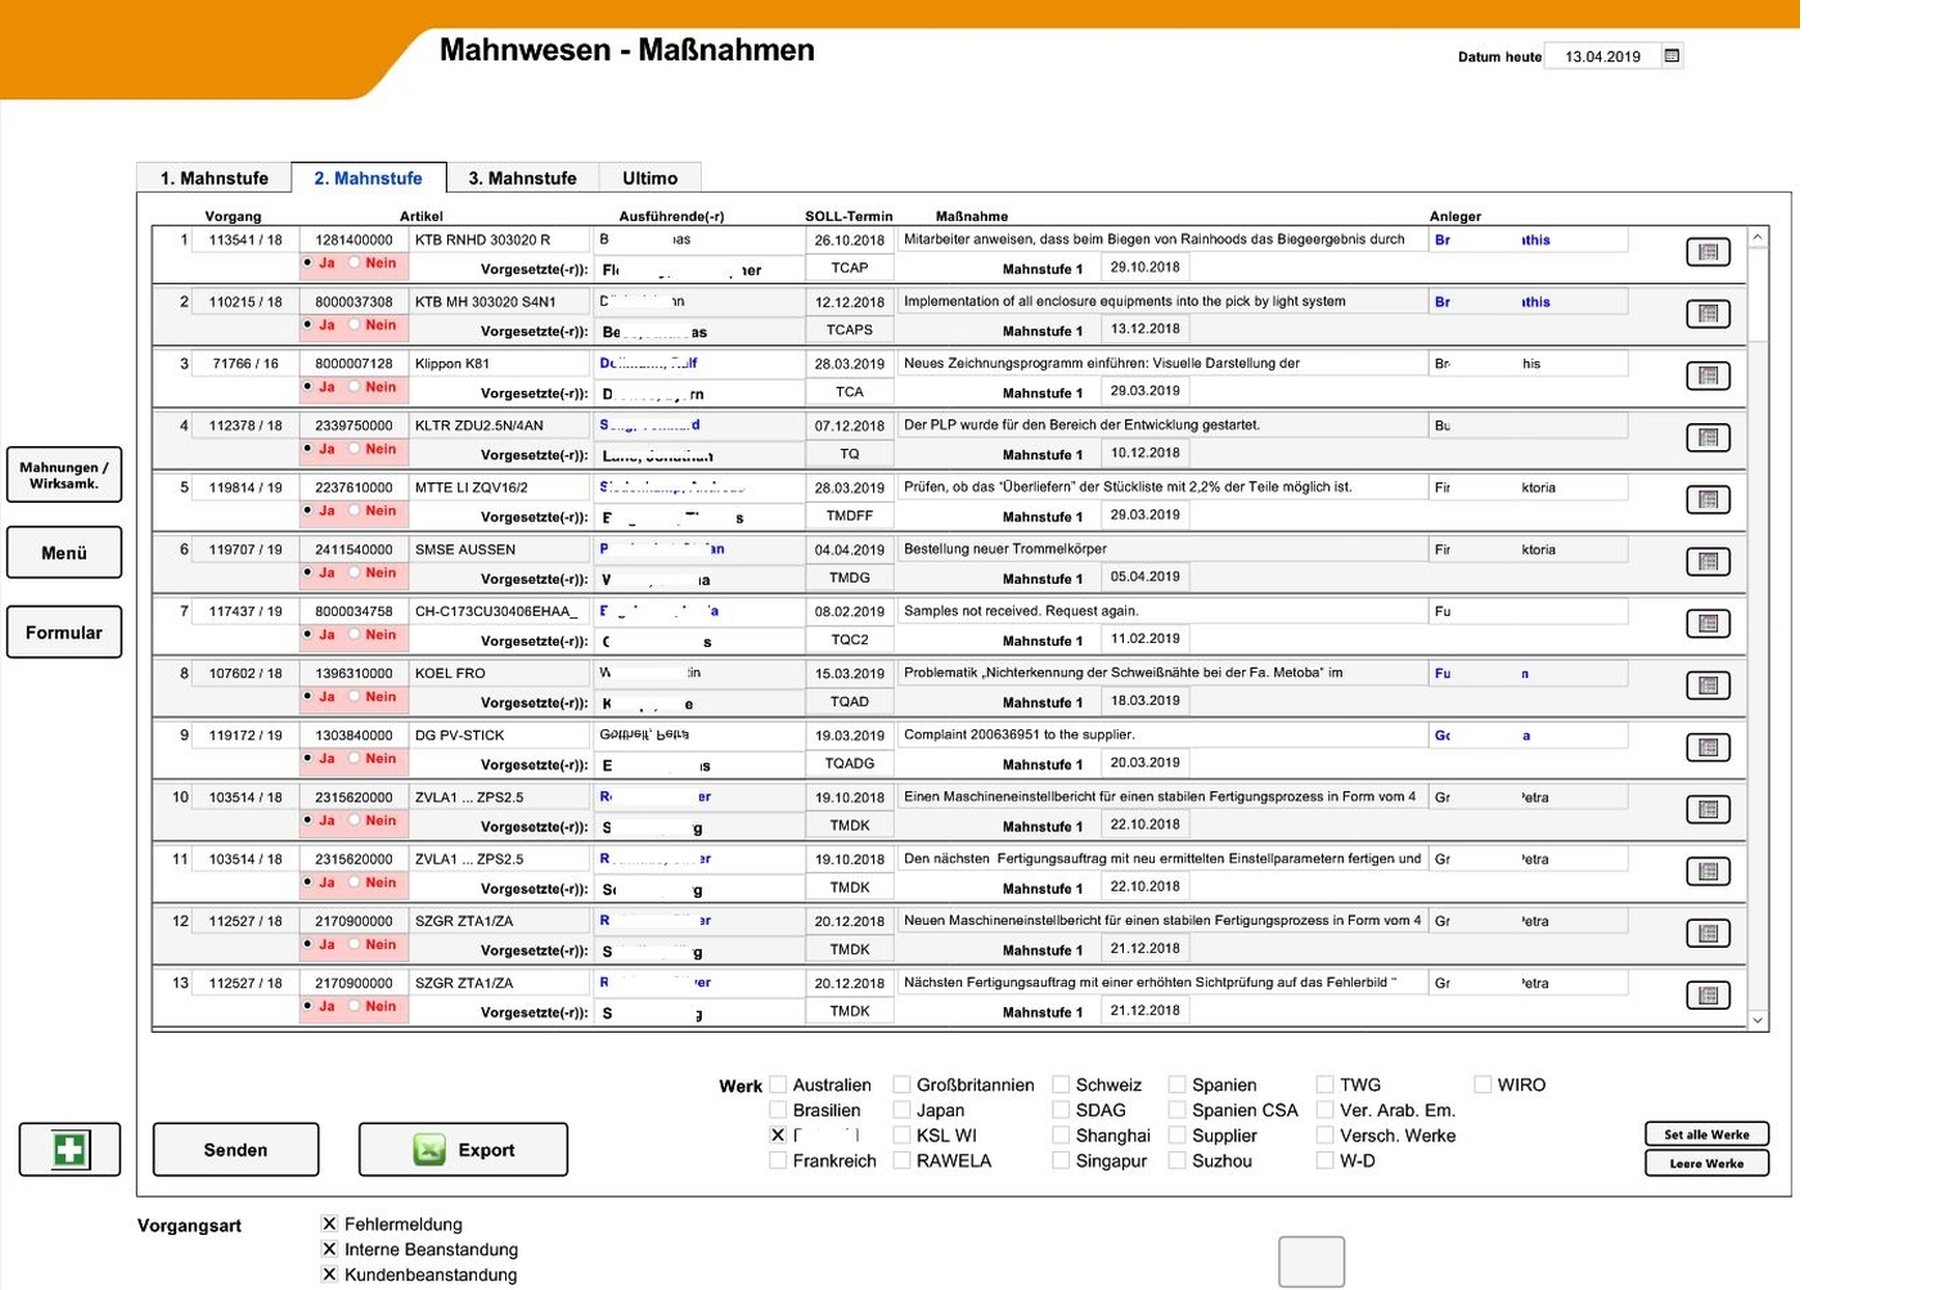
The following view shows a visualization of errors for selected articles. For a previously selected article group, the occurrence of selectable errors can be displayed as a function of time. The configured colors represent the number of tasks. The possible time horizon is 20 years. Here the number of years is selected.

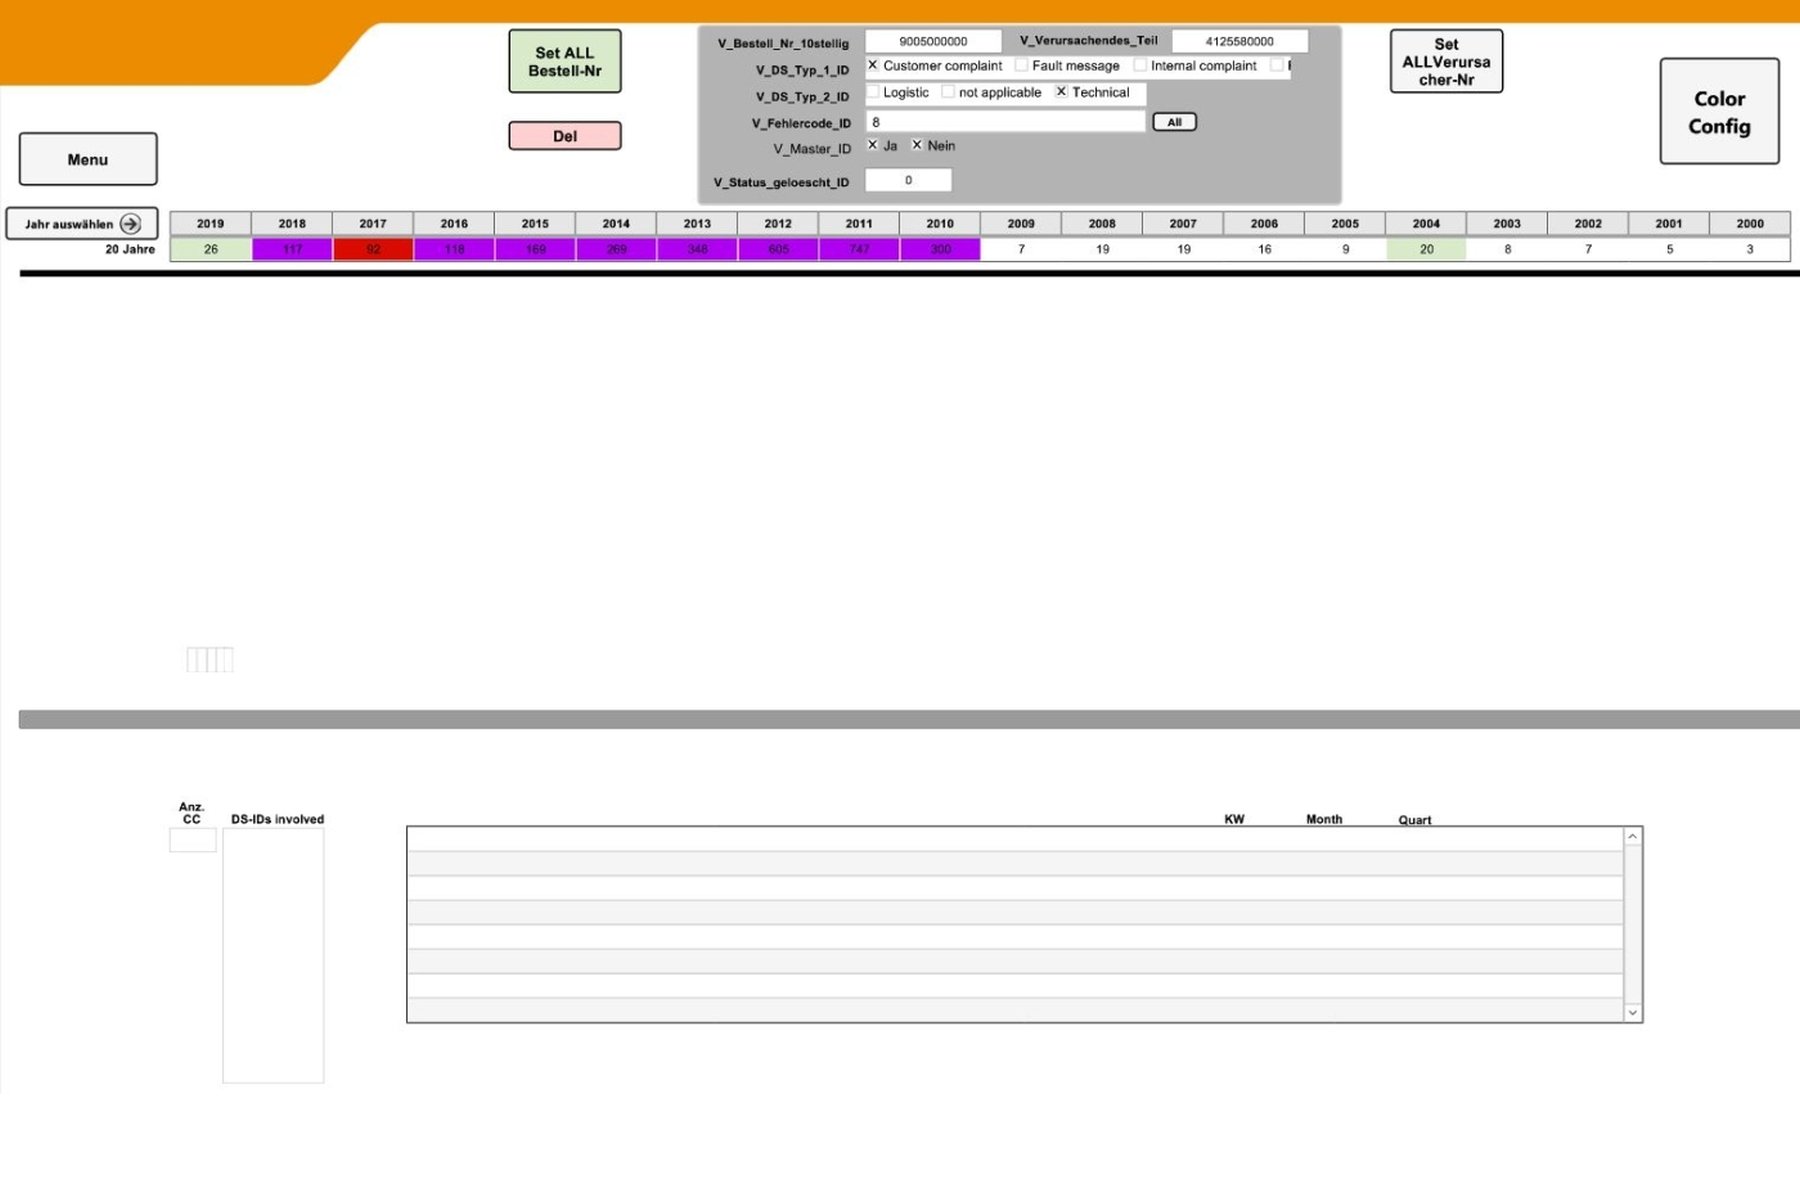
In the next stage, the 5-year period is shown in descending order at quarterly and monthly level. The weeks can no longer be labeled, but can still be used as indicators.
In this layer, weeks are displayed as days.
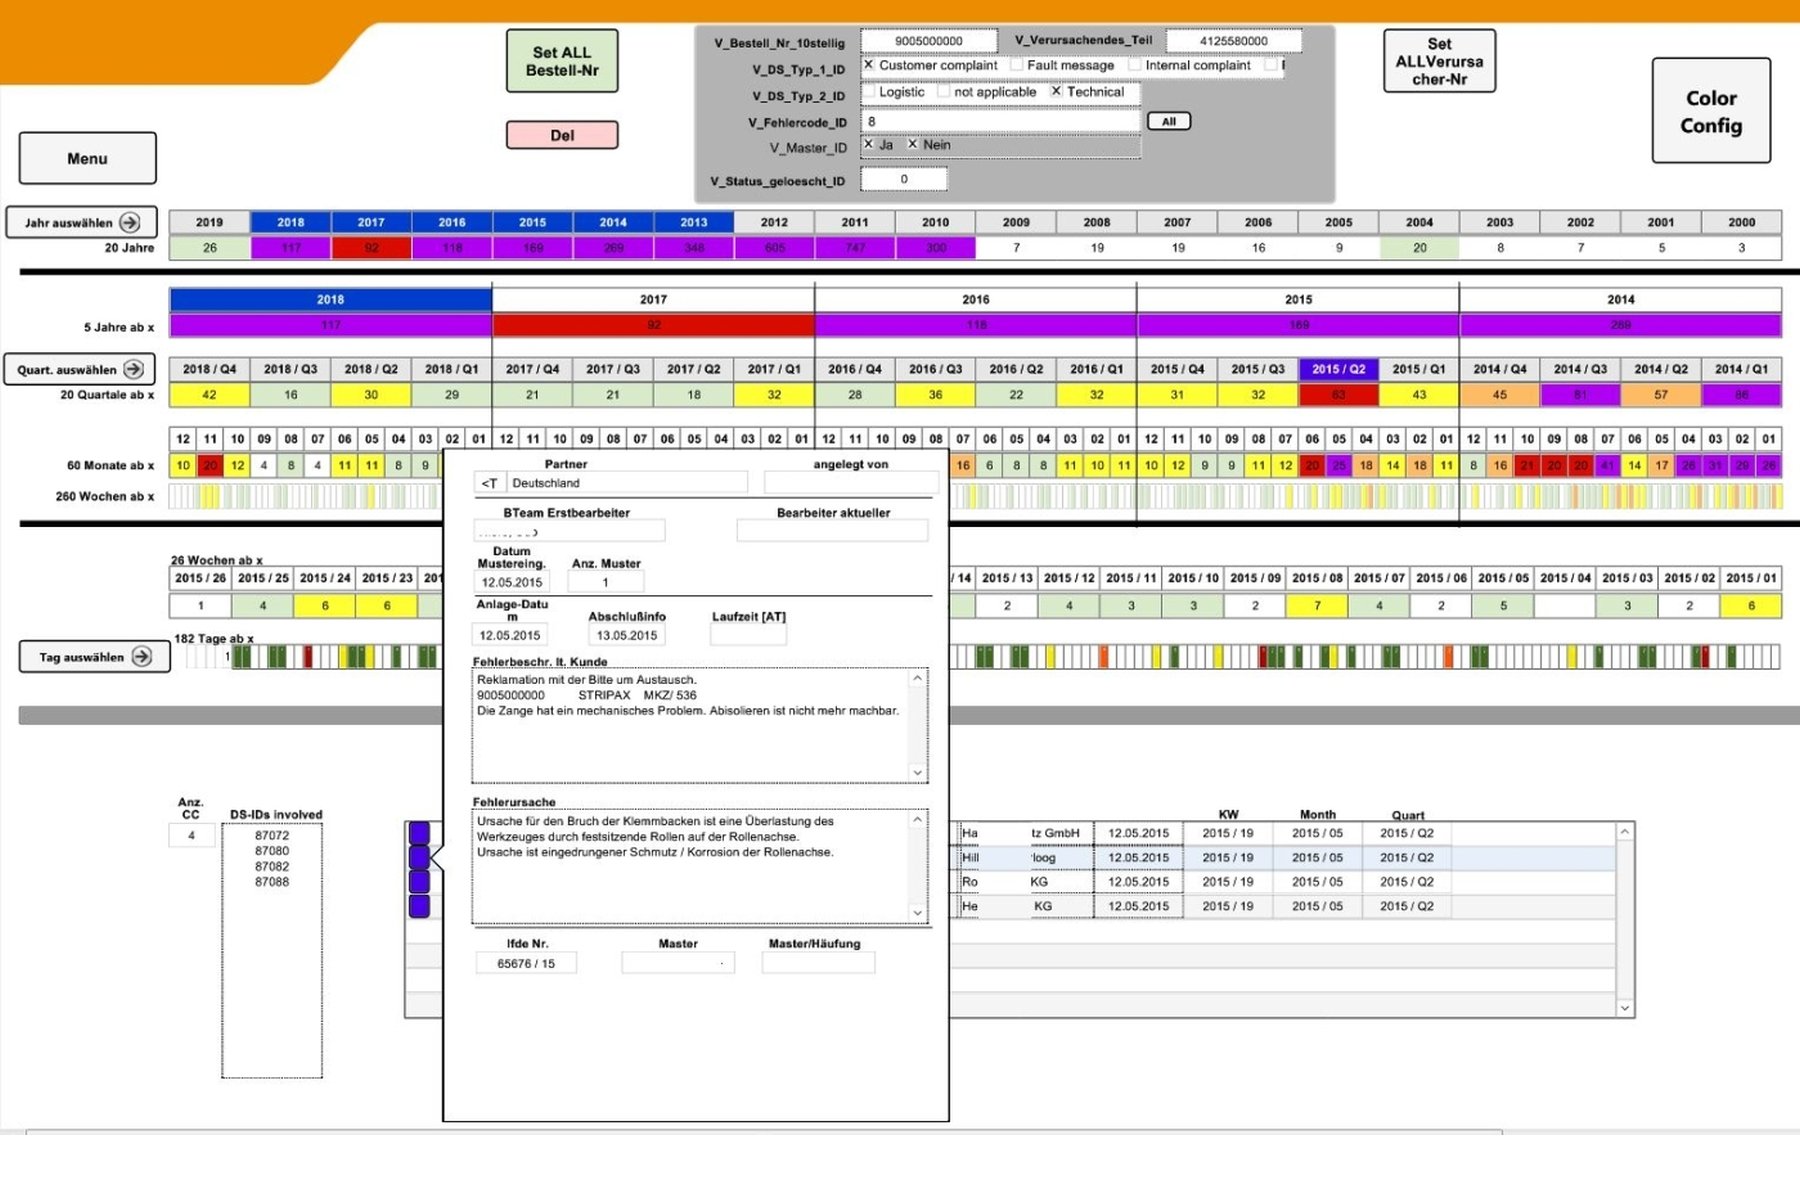
A click on the time unit (here week), shows the tasks below. A small pre-view is possible

One of the many thematically focused list views with a preview of the most important information.
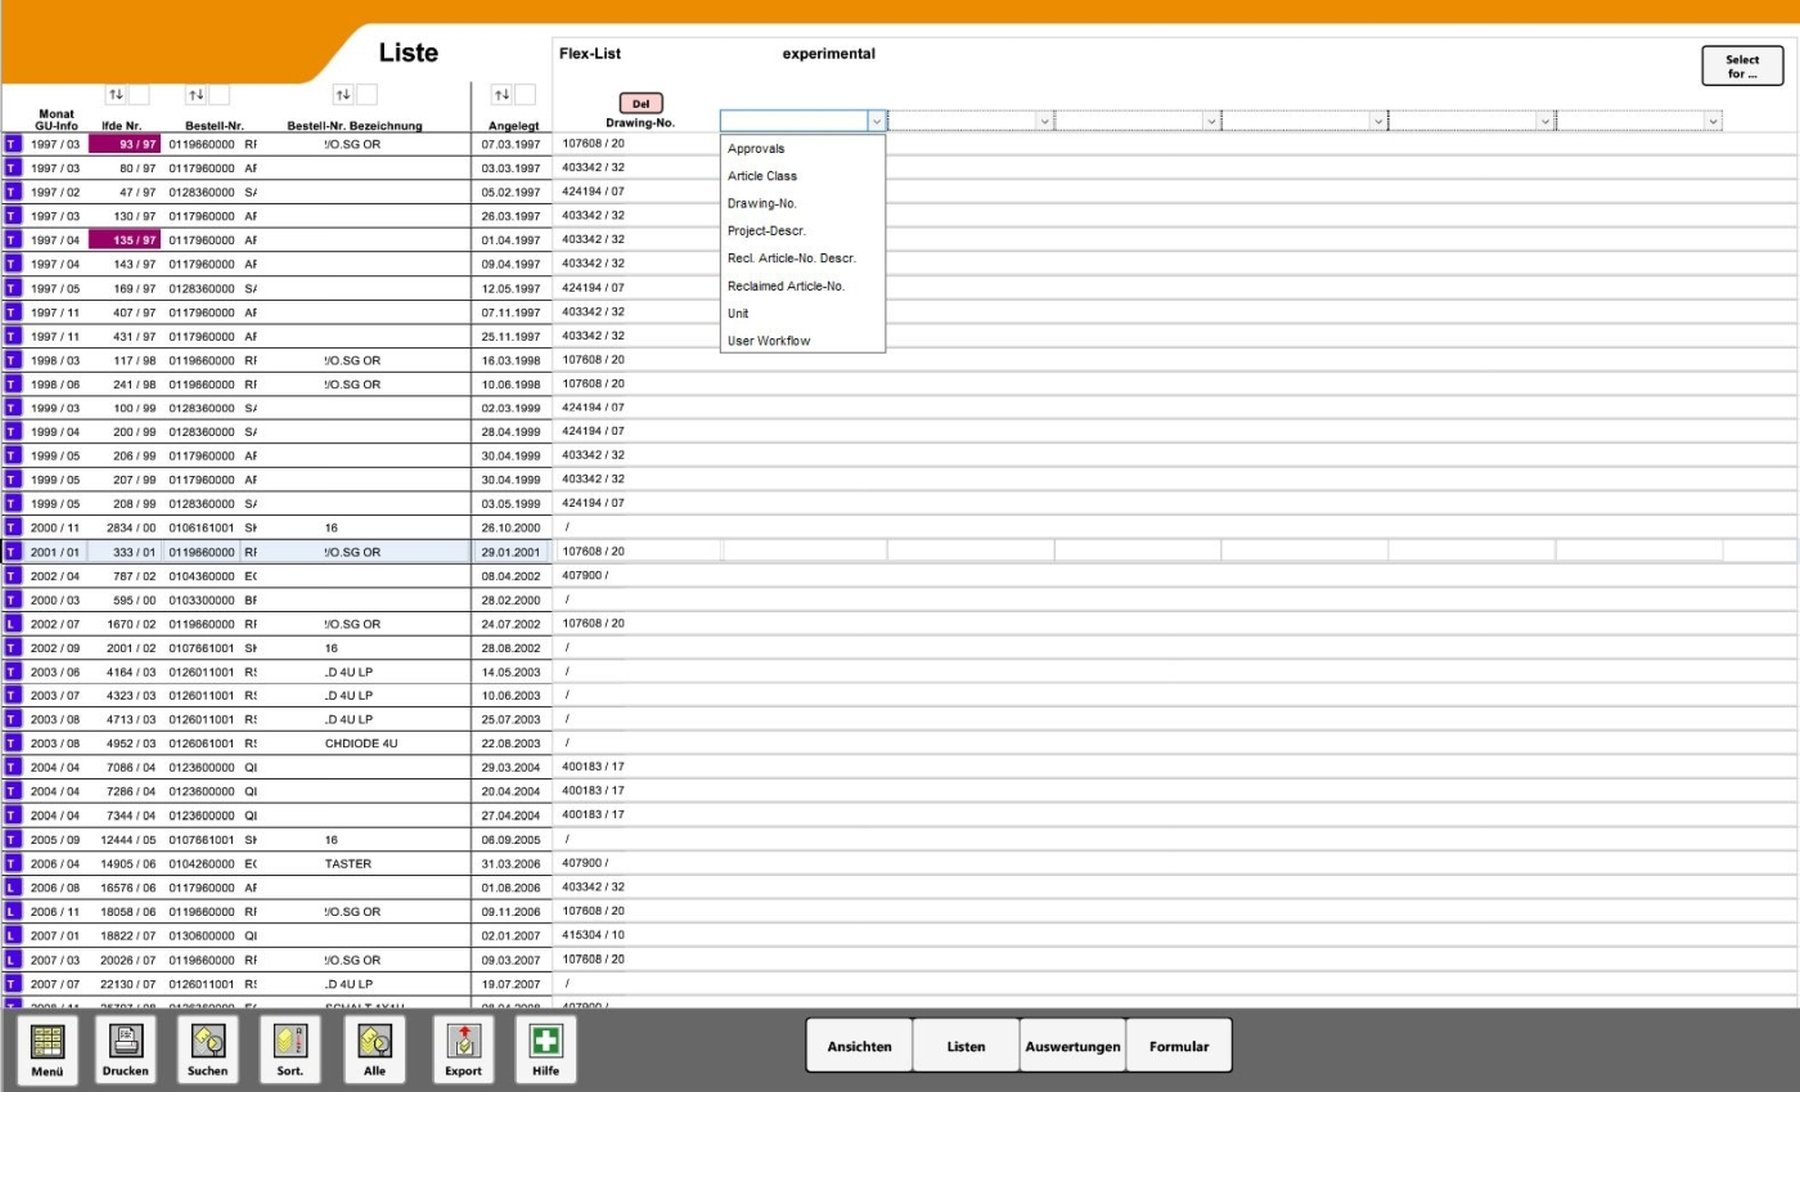
A special list in which users could compile their own content.
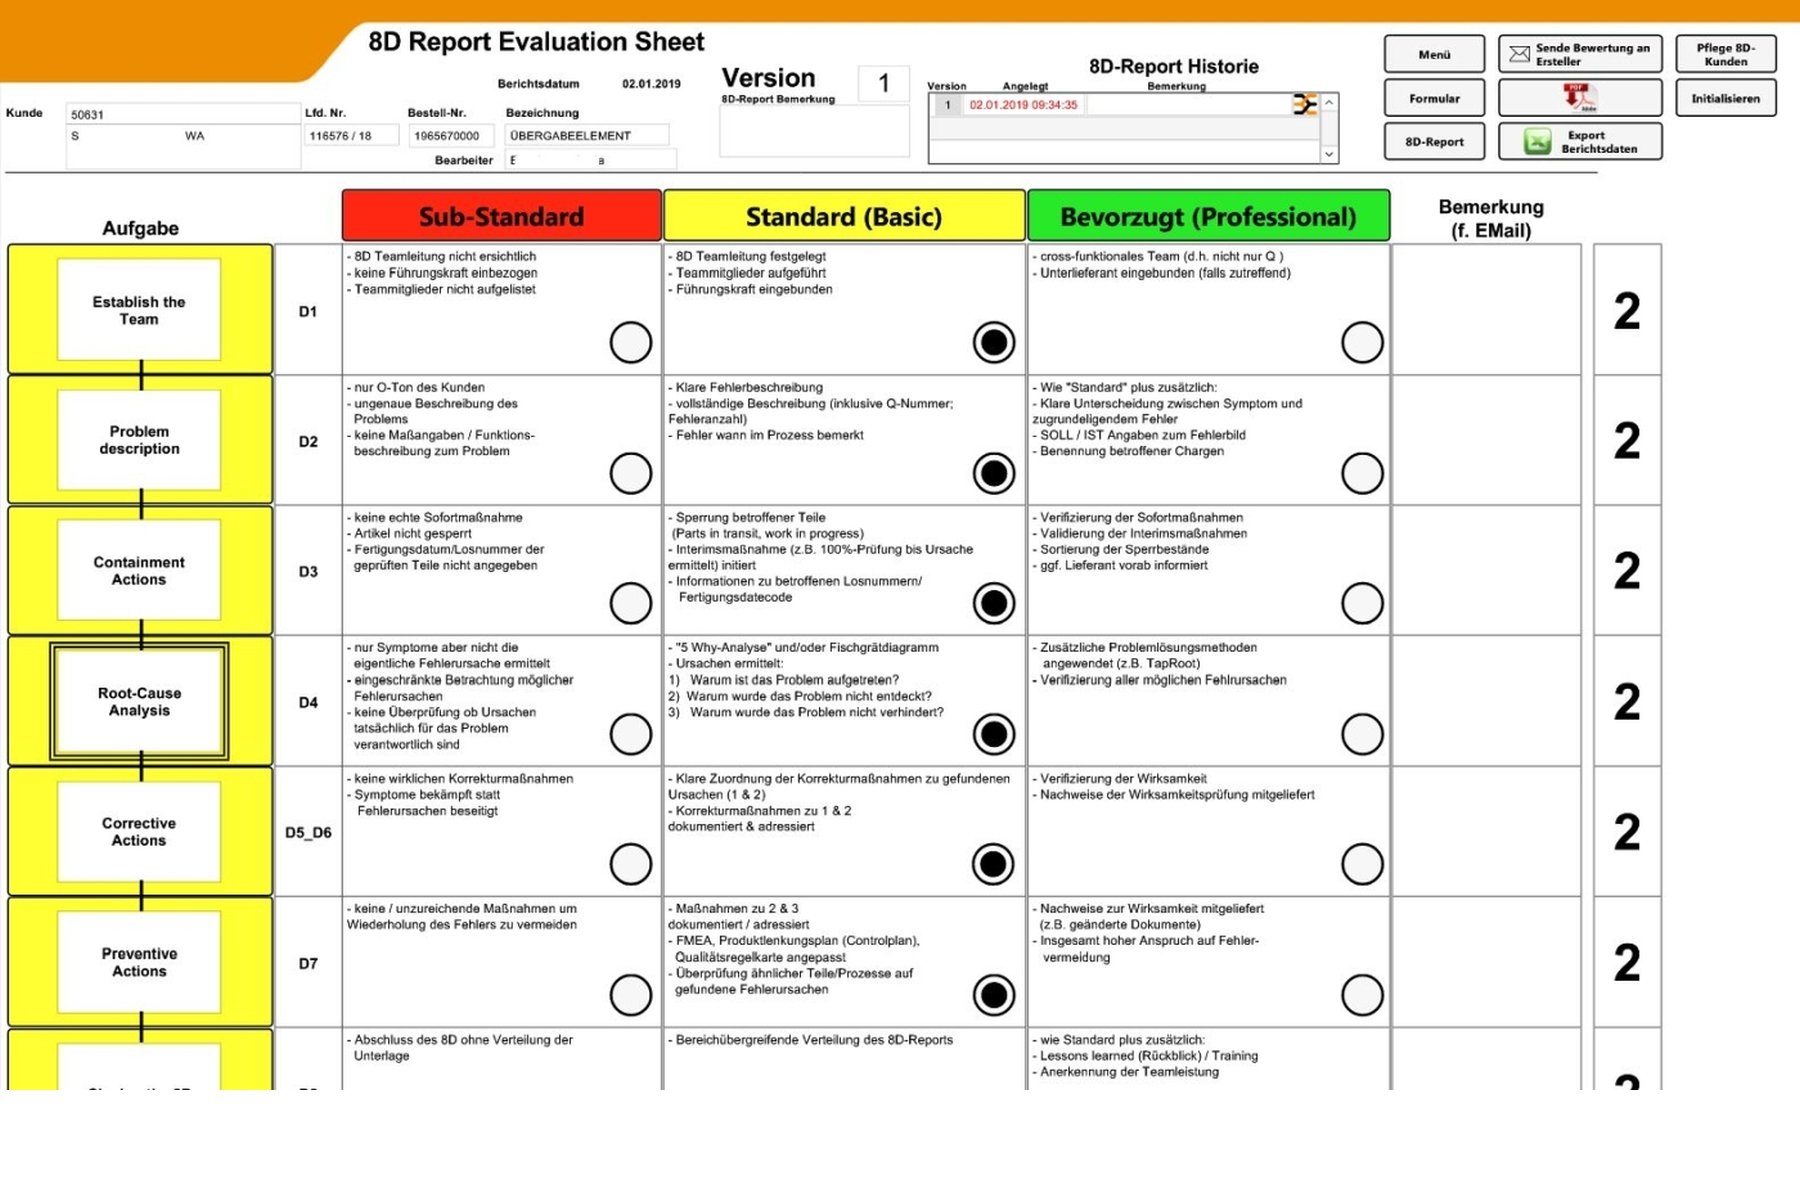
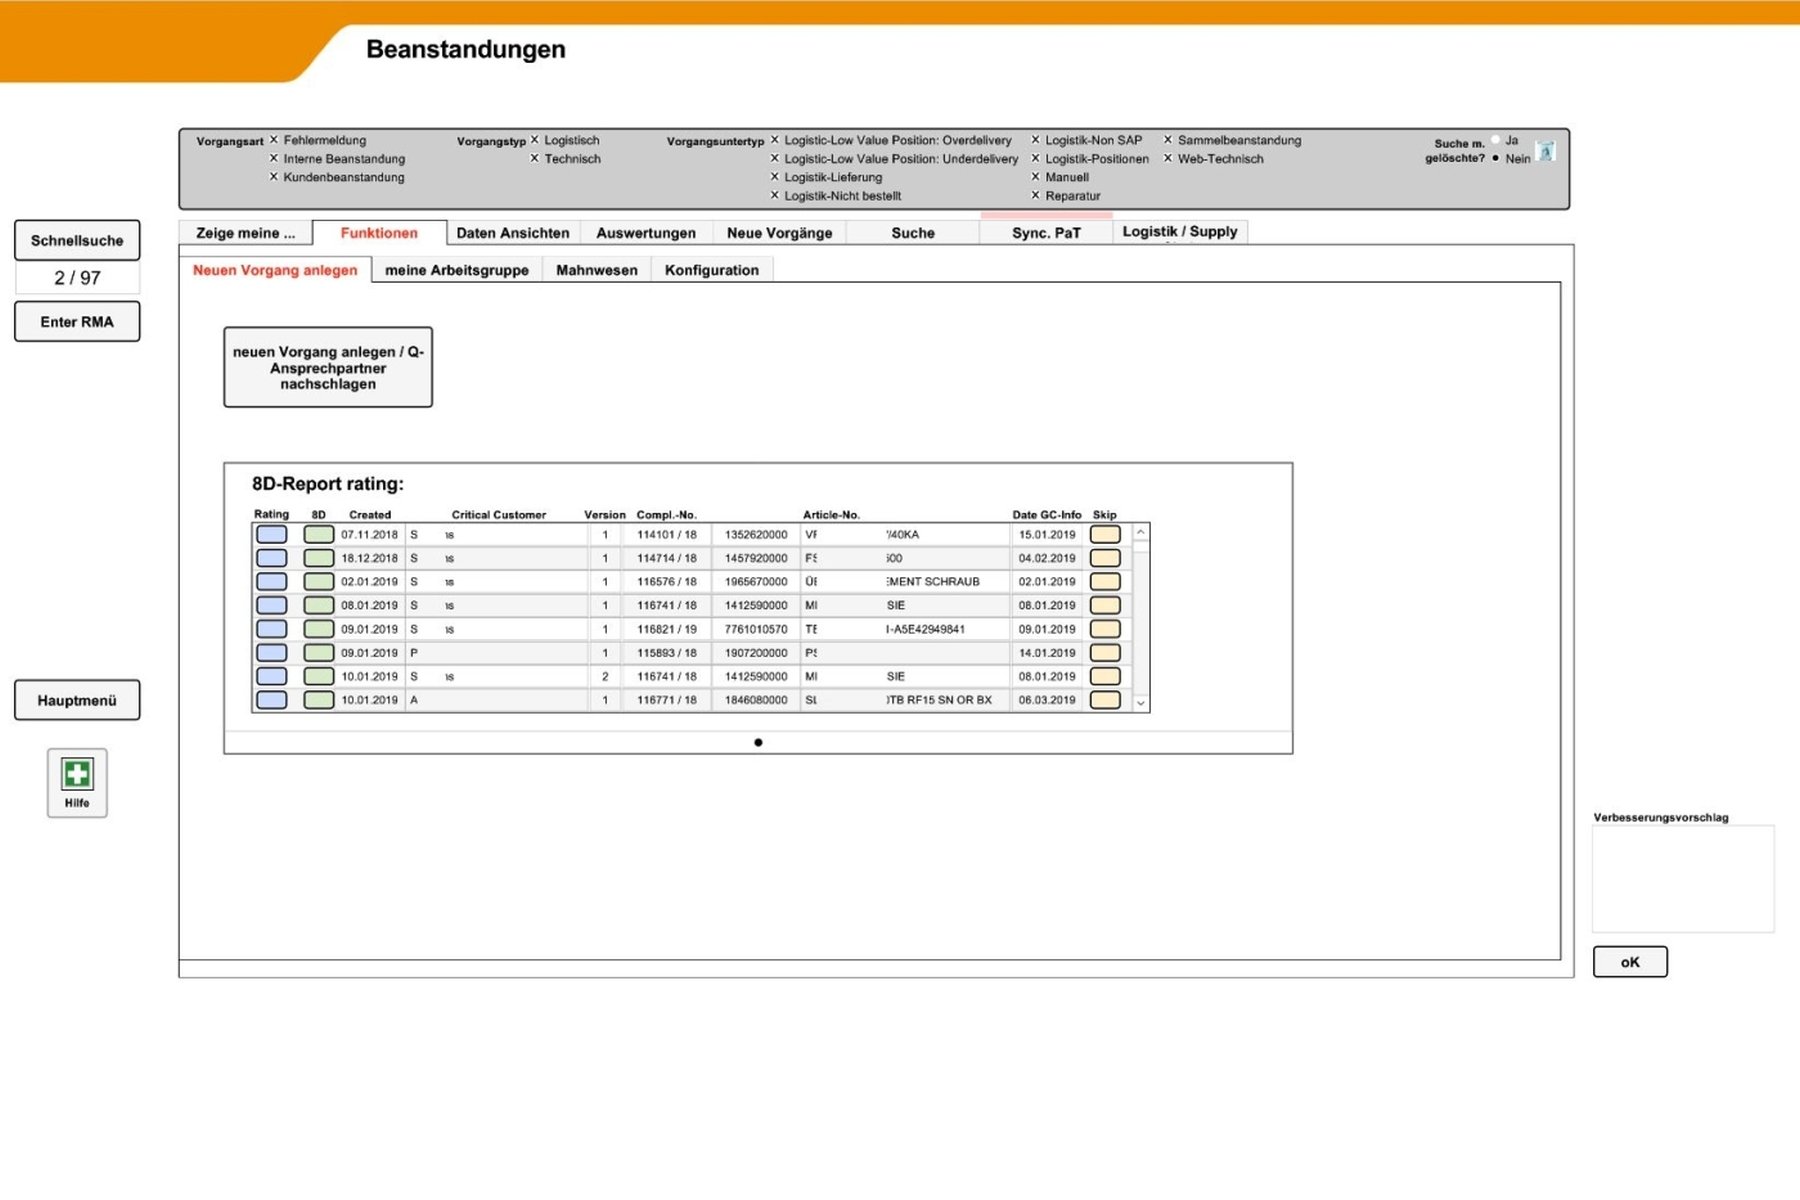
In order to improve the quality of content processing according to the 8D system, a review option has been set up for supervisors. 8D reports could be selected and evaluated according to this matrix by clicking on the individual points. An overall score was then calculated according to the number of points achieved and the result was automatically sent to the creator by email. The creator then had to improve the report if the score was insufficient.