Dashboard for visualizing all business processes with their implementation status across all Group structures
Problem definition:
Across the world, units belonging to the corporate group had various functions to fulfill. Some only had sales functions and others also performed production functions via product development. Accordingly, the applicable DIN/ISO areas were different.
Situation before:
Central process management only needed a constantly updated overview of which DIN/ISO elements were used where and what the current degree of implementation was.
This had to be done using manually sent Excel spreadsheets, each containing a matrix of the 145 processes and the 35 organizational units. In this matrix, each organizational unit should have documented the applicability of the process, the degree of fulfillment and, if applicable, the date of completion. Later, these 35 Excel files were to be merged again, manually. This return would have had to be done later for each change/addition, which would have been an incredibly time consuming and error-prone task.
Situation afterwards:
My system managed a lot of information per process and per organizational unit, which was assigned to each other in a cross-matrix. This meant that bi-directional queries (e.g. "Which processes in country xy", or "Where does process xy apply") were also possible without any problems.
As the responsible persons can maintain data at any time via browser, the system shows the current overall status of process management at any time without any additional manual effort. A wide variety of reports (e.g. per region or sub-structure) were also possible.
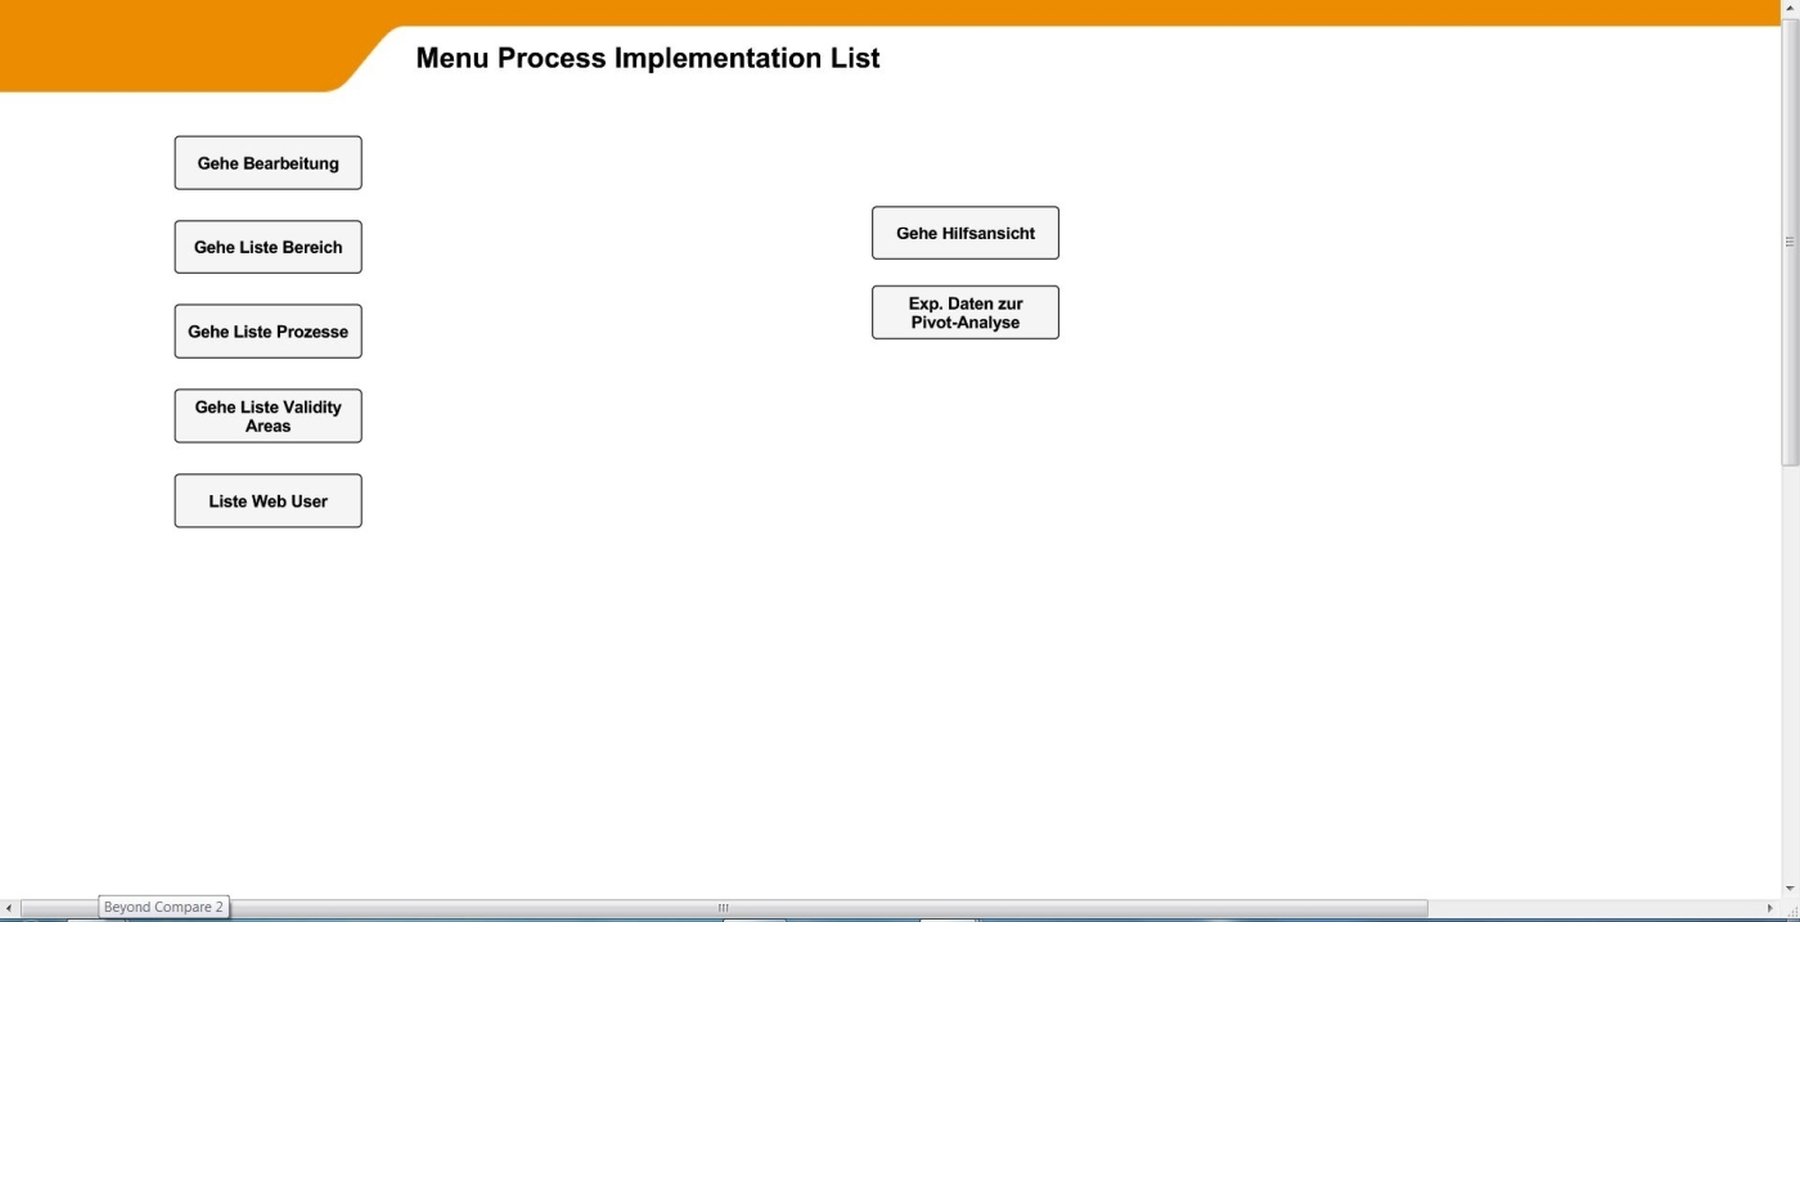
Menu
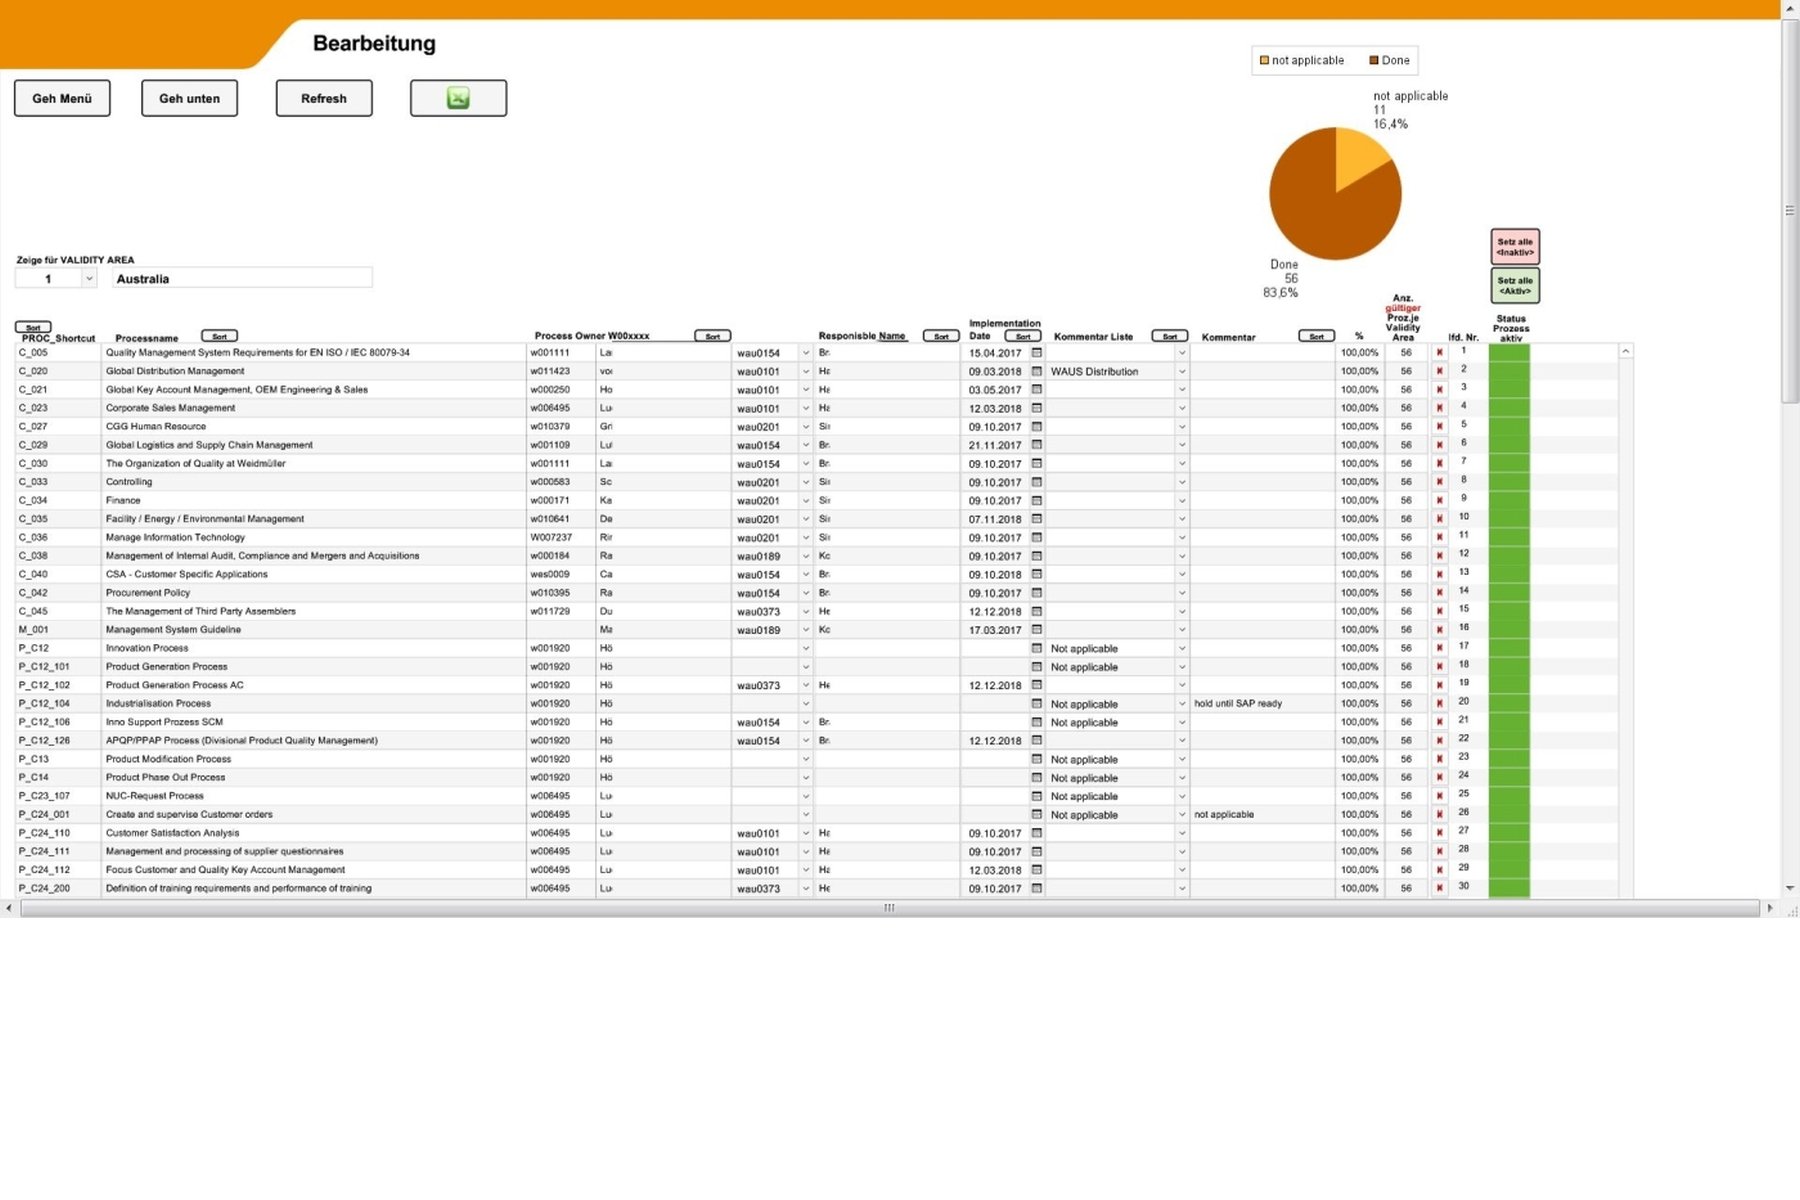
Overview and configuration for each country: Here "Australia"
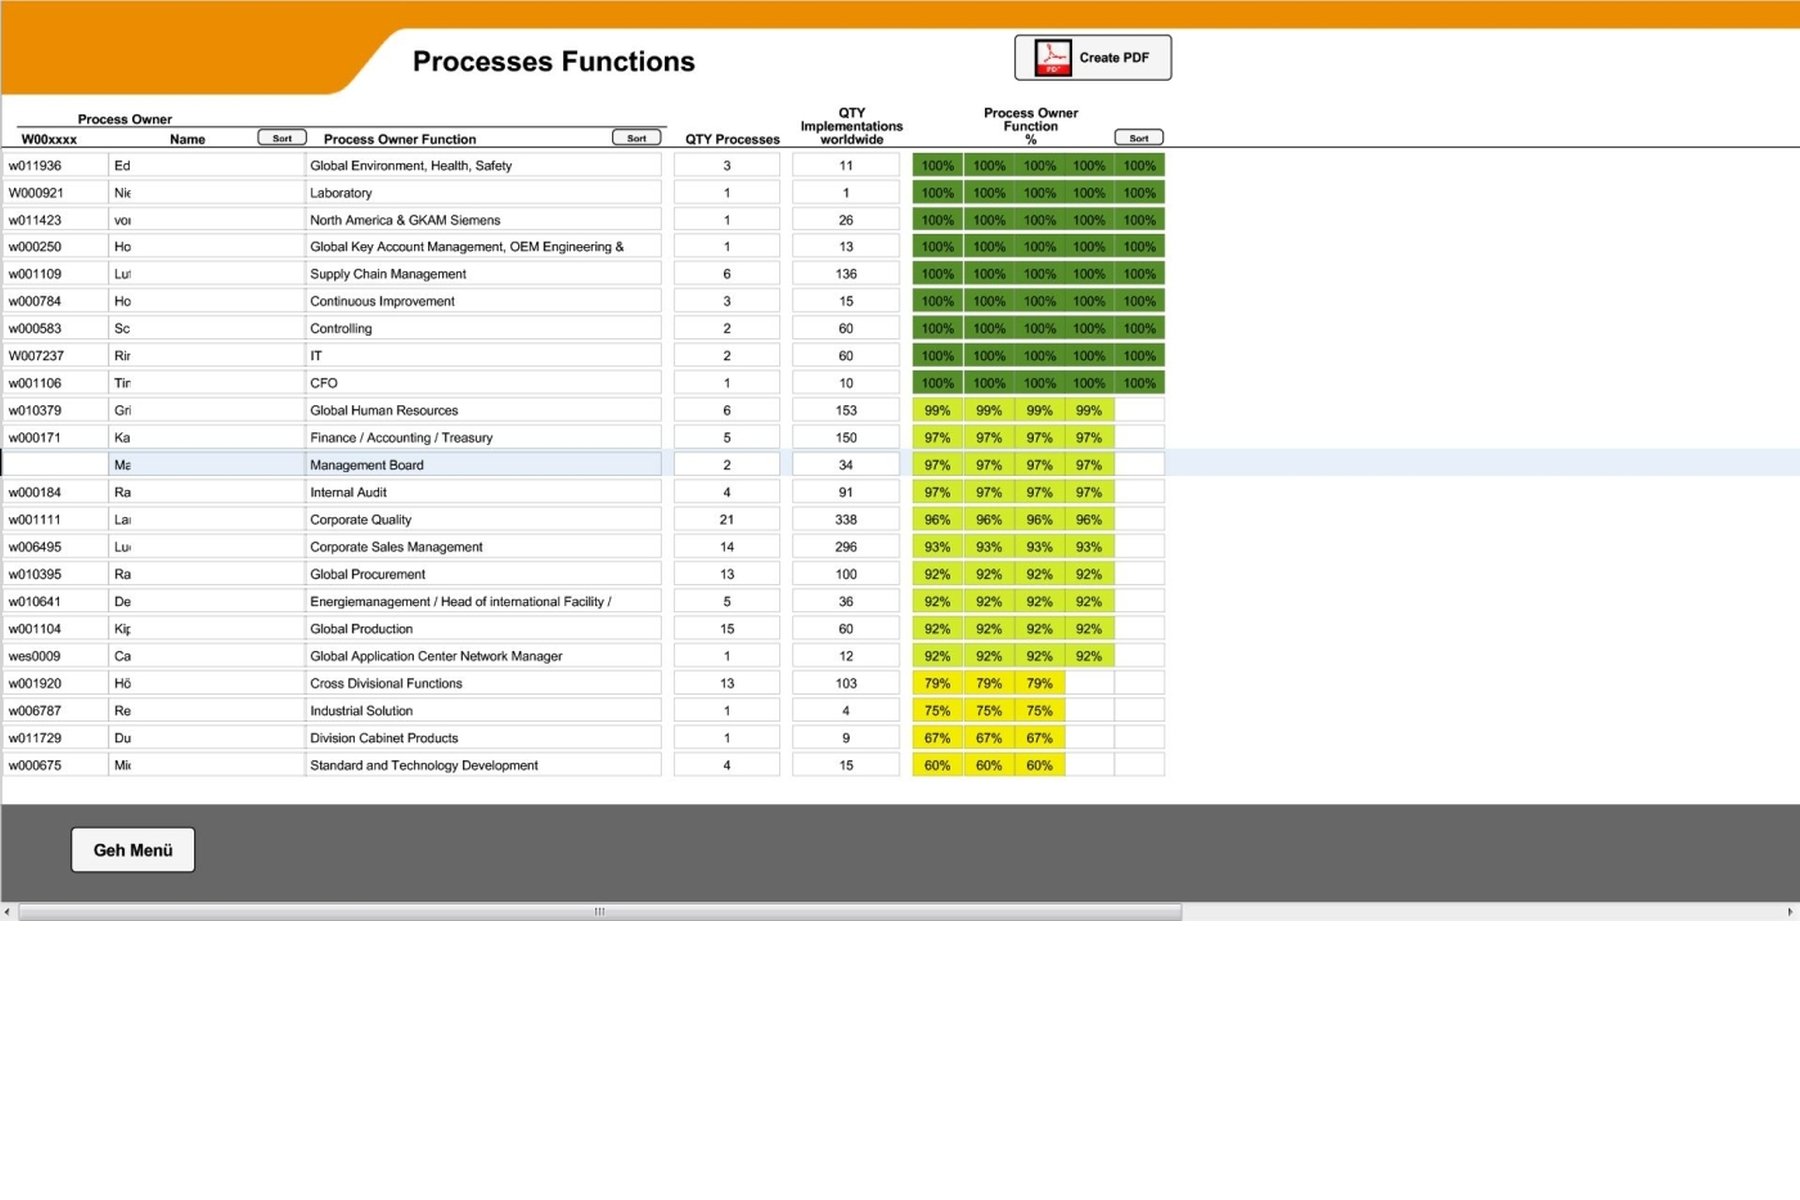
The applicability of each process at each location can be displayed, as can the processes that apply at each possible location.
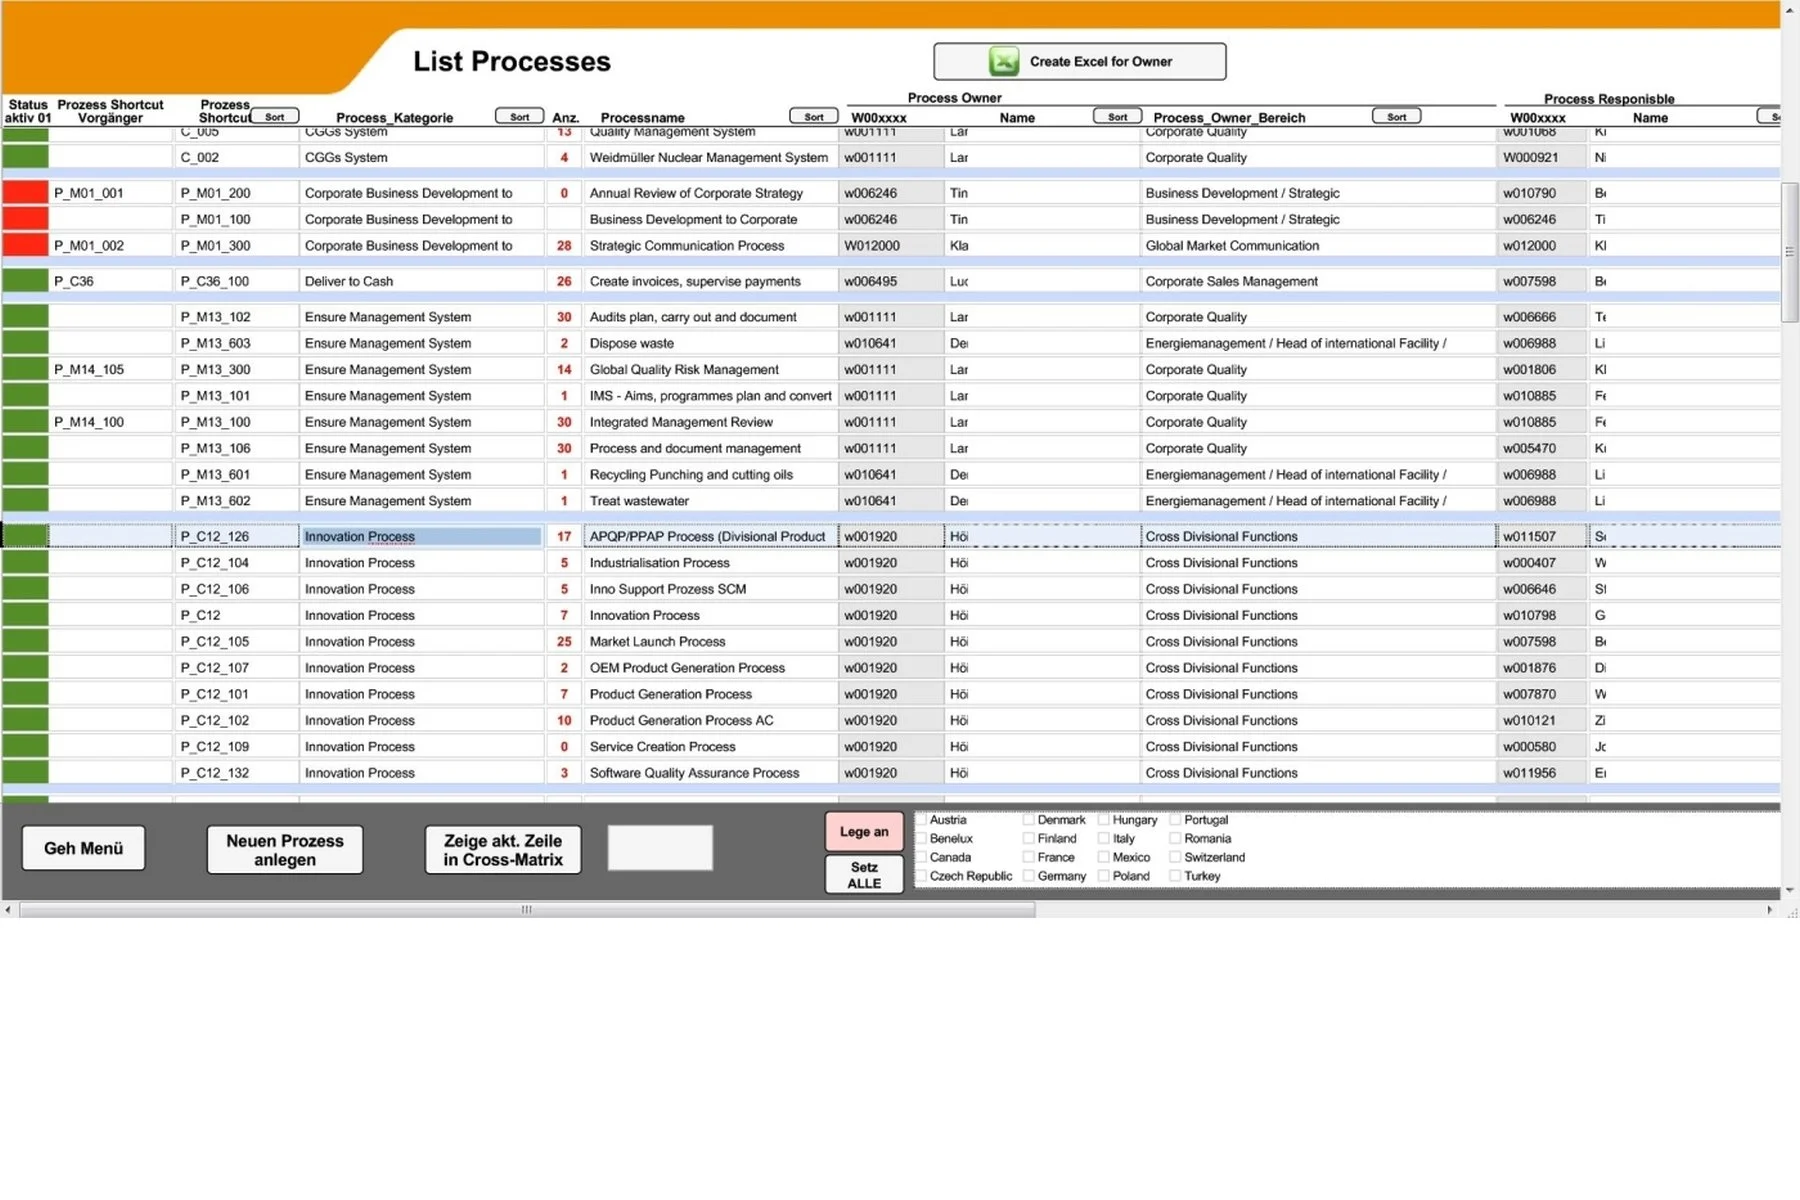
Presetting processes to org.-units
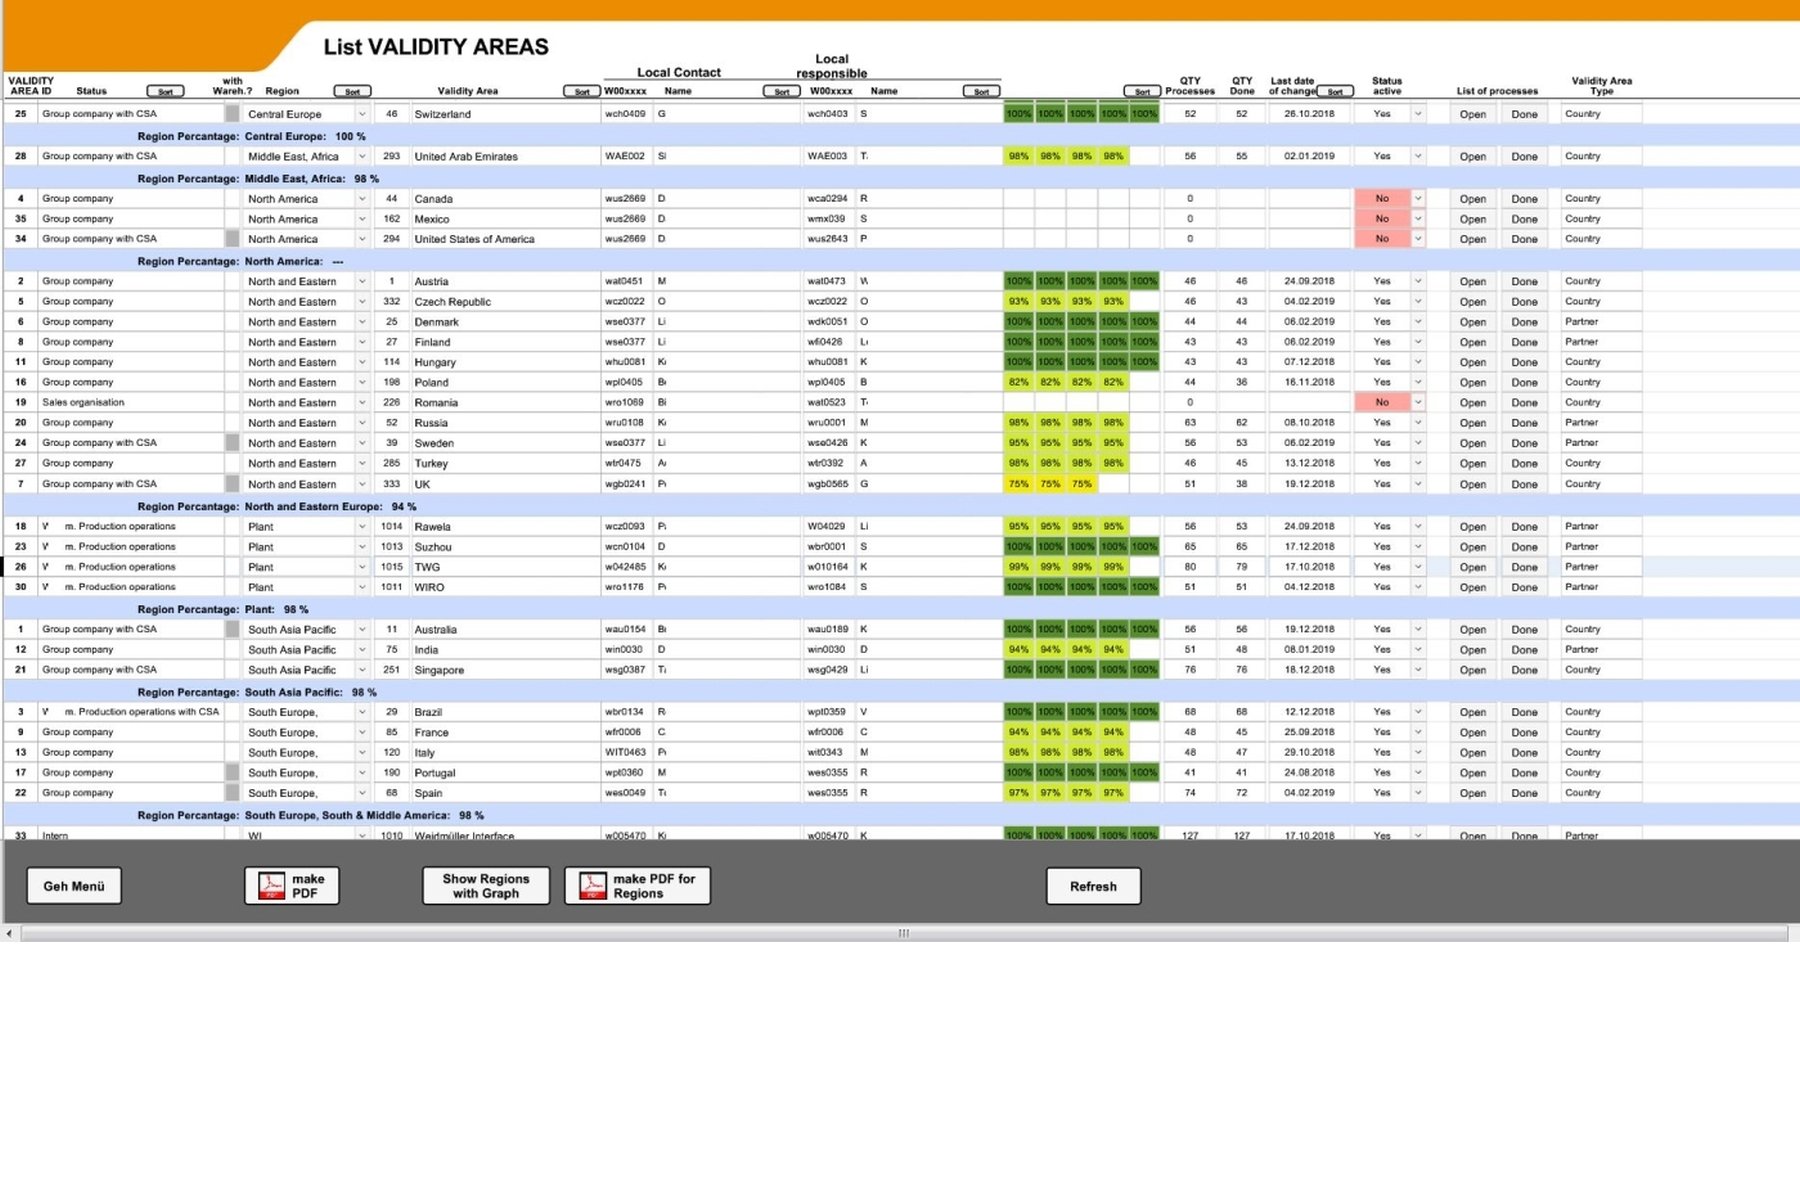
Overview of implementation level according to regions
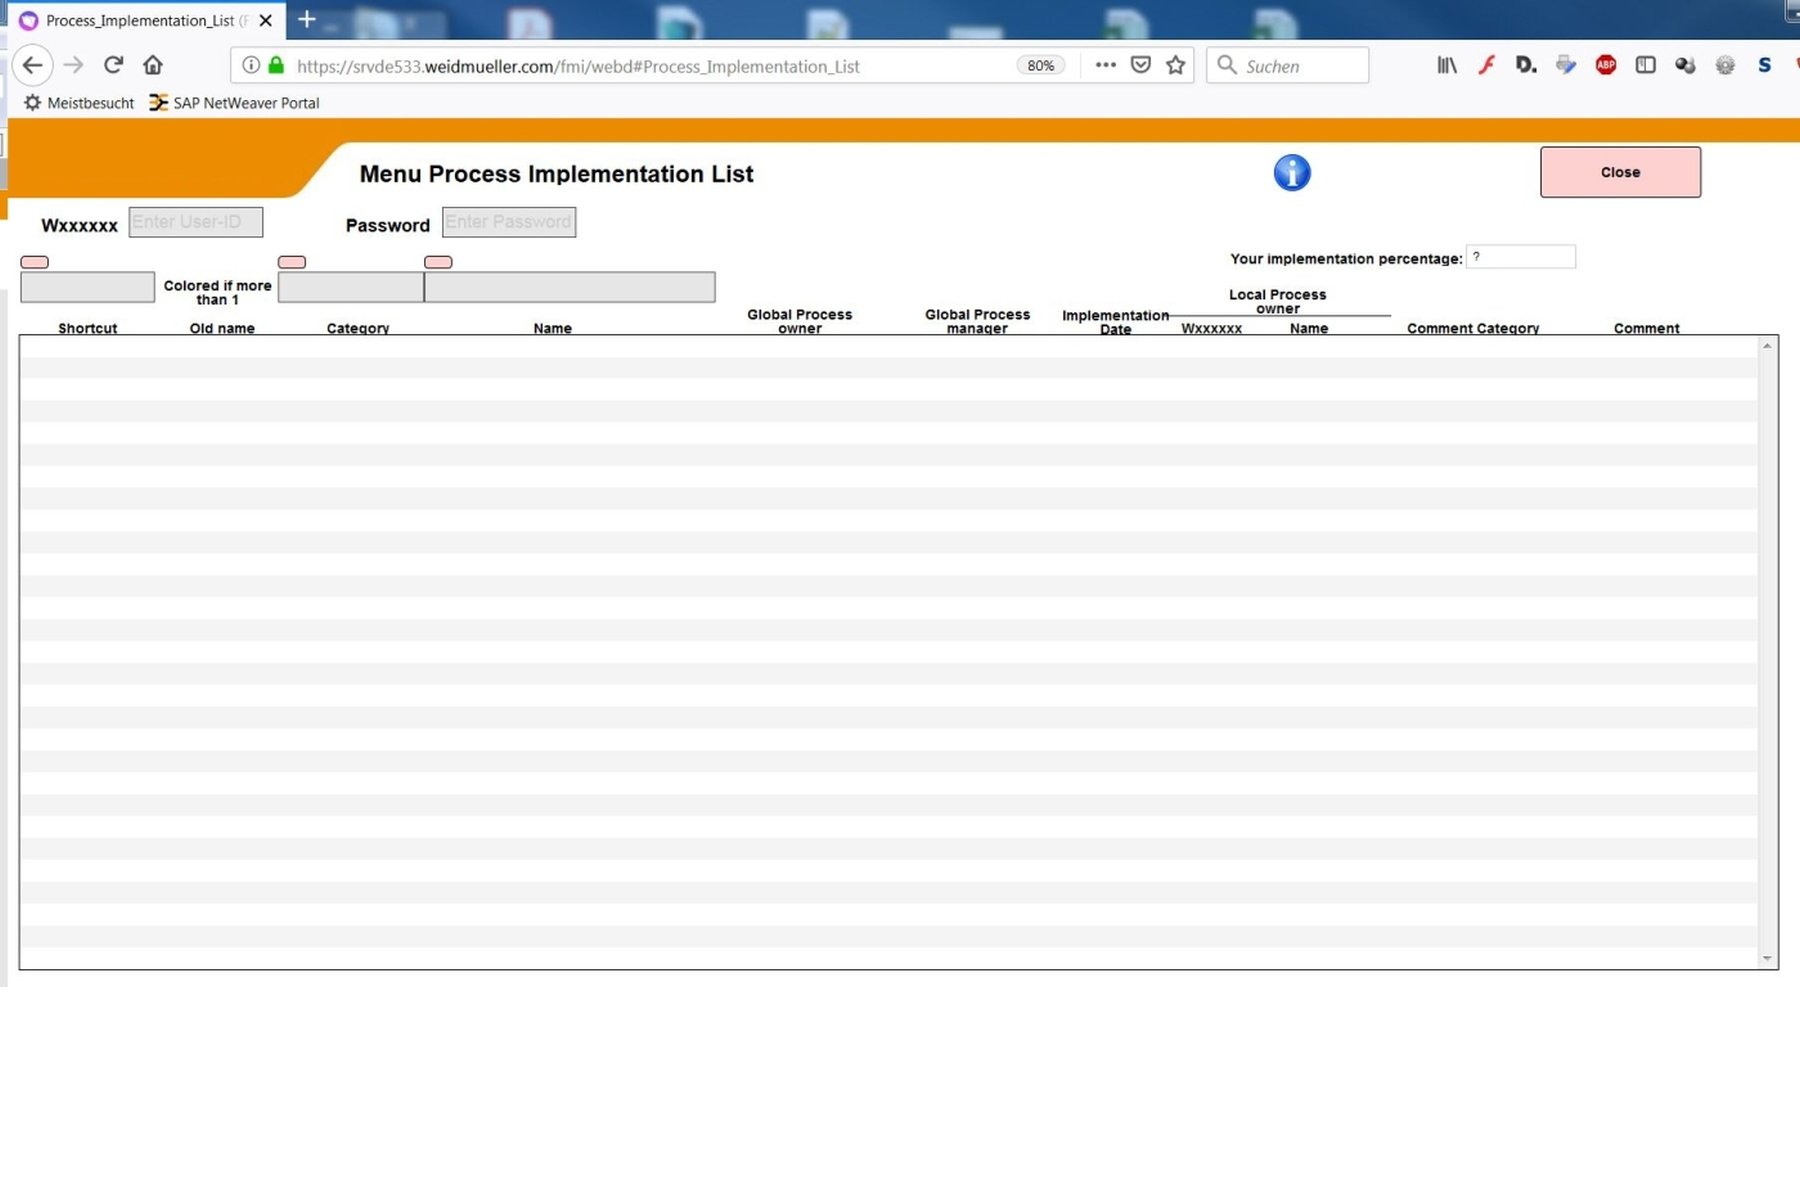
Intranet Web-Form the process managers used world-wide
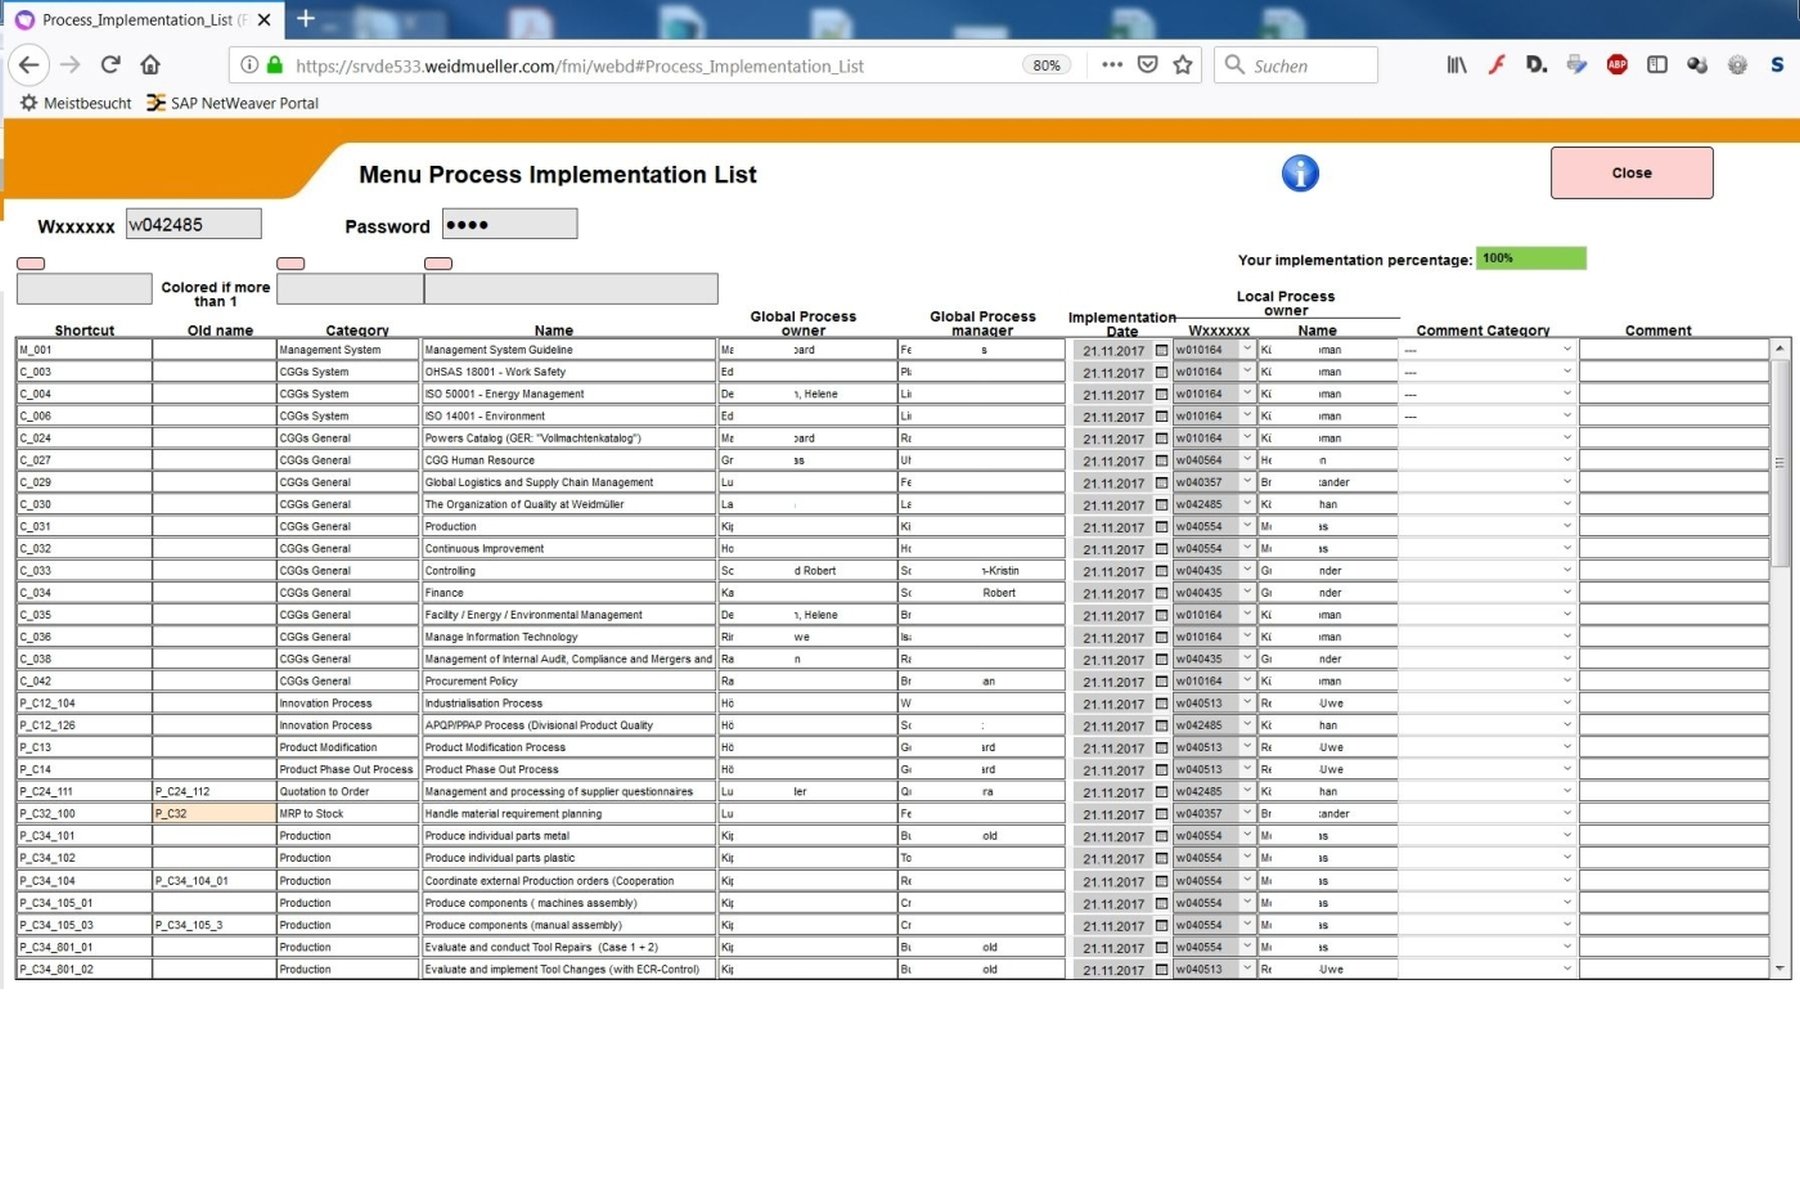
Columns can be filtered and the fulfillment status can be entered and commented
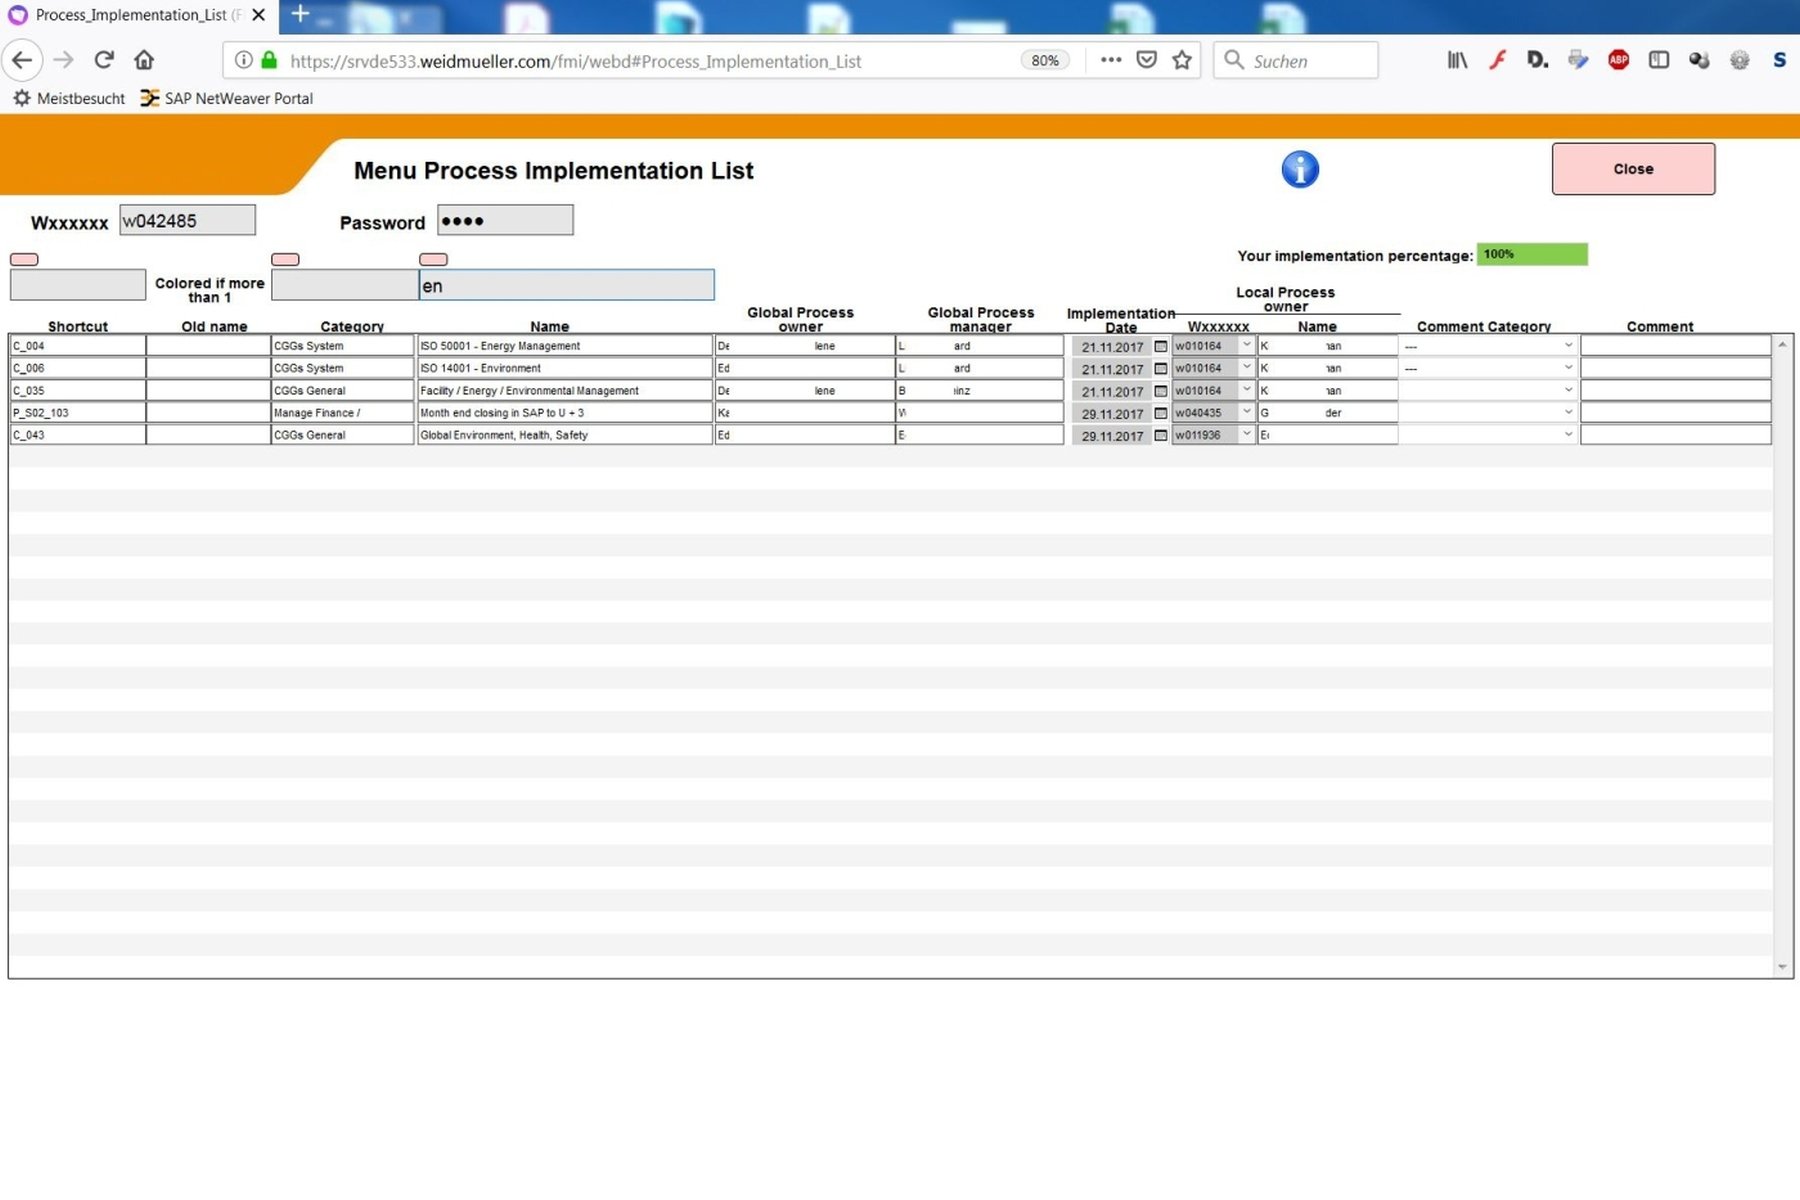
Filtered processes for one production-plant
