Sales report: Example for a building materials retailer
A sales report is an important tool for analyzing and evaluating sales figures and business developments in a company. In a building materials retailer, this report provides information on sales performance, goods movements, sales development and the effectiveness of marketing and sales strategies. Relevant key figures and visual representations, such as diagrams and tables, are used to present the data clearly and comprehensibly. The following is a detailed example of a sales report for a building materials retailer. Please note that all data shown is exemplary and not real. The charts and tables can be adapted to the specific needs and requirements of the company.
1. General information
At the beginning of each sales report, basic information on the current point in time is displayed.
Report date: Always the date of the last data update
Business sector: Building materials trade
Geographical region: Canada
Objective of the report: Analysis of sales figures, identification of trends, identification of sales potential
2. Total turnover and sales volume
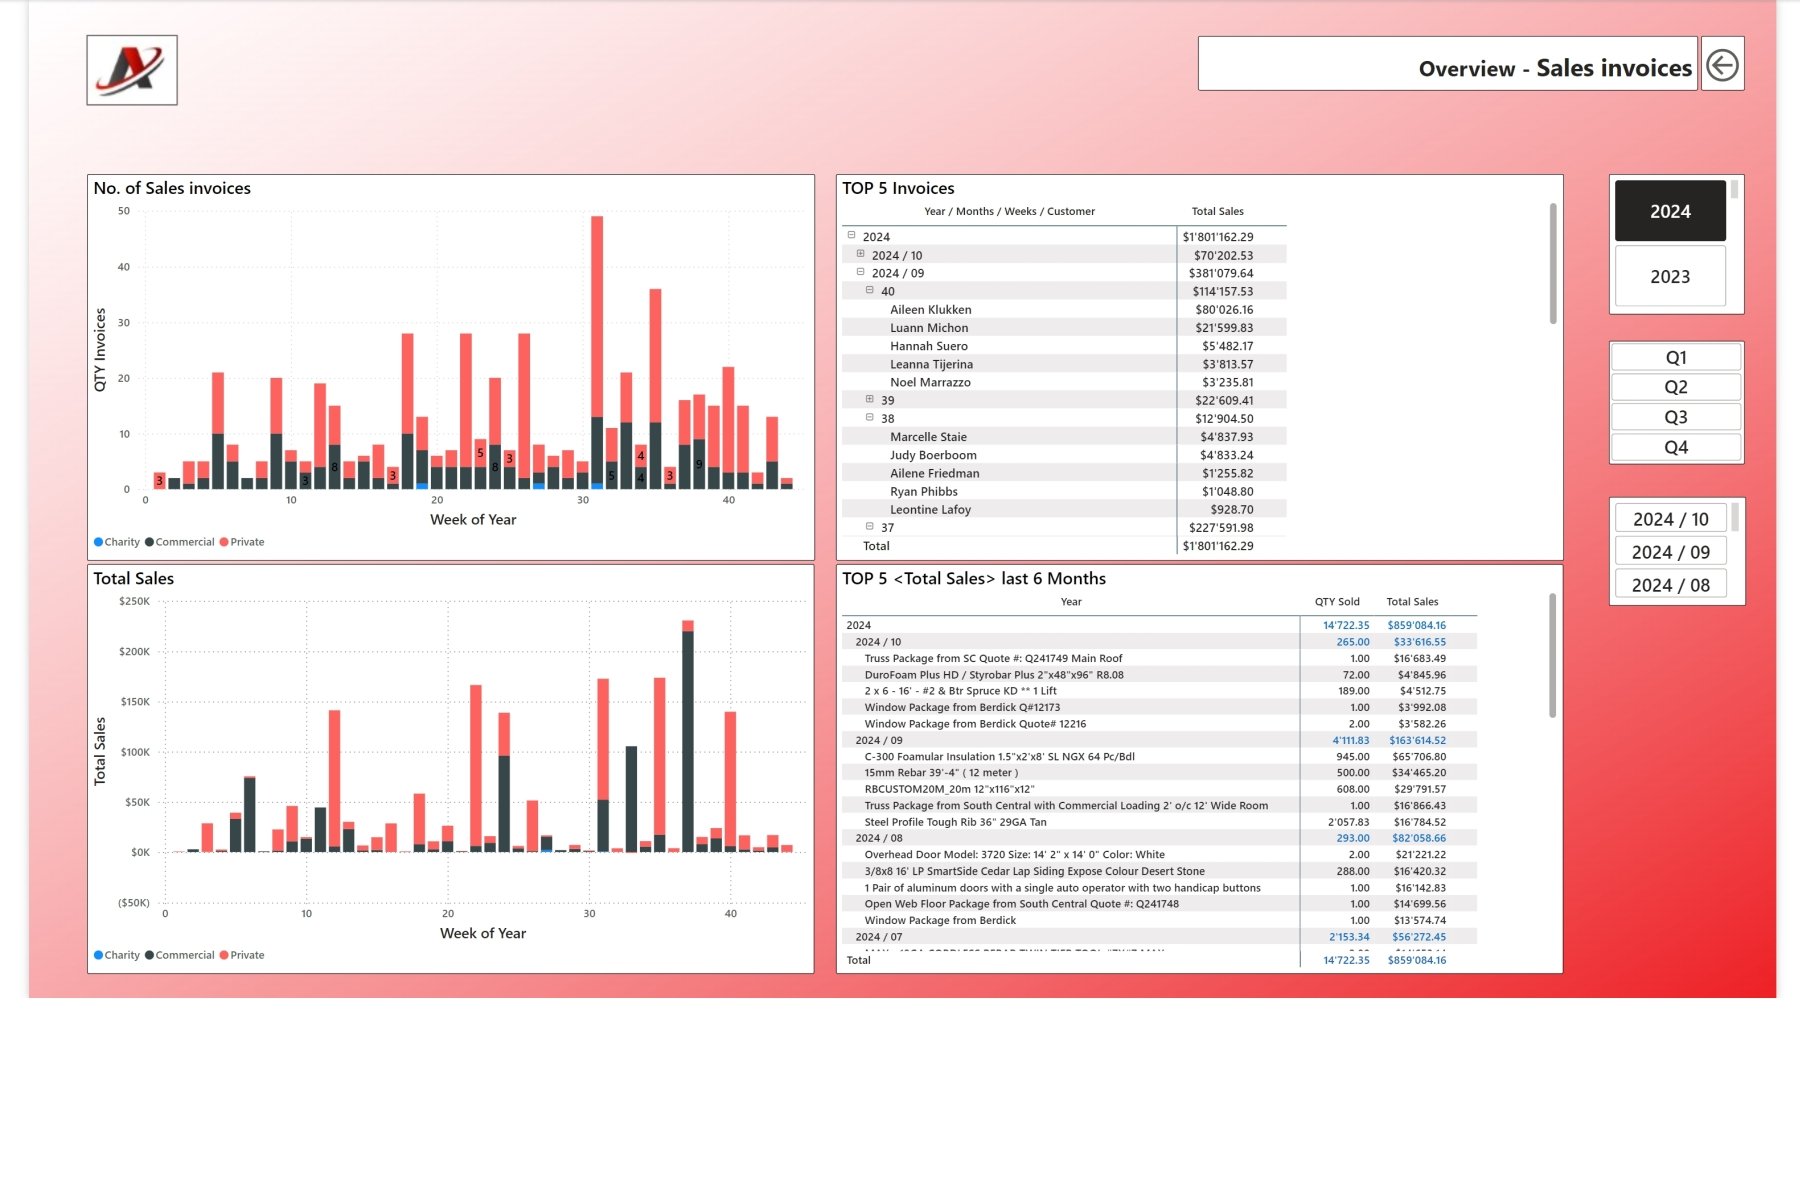
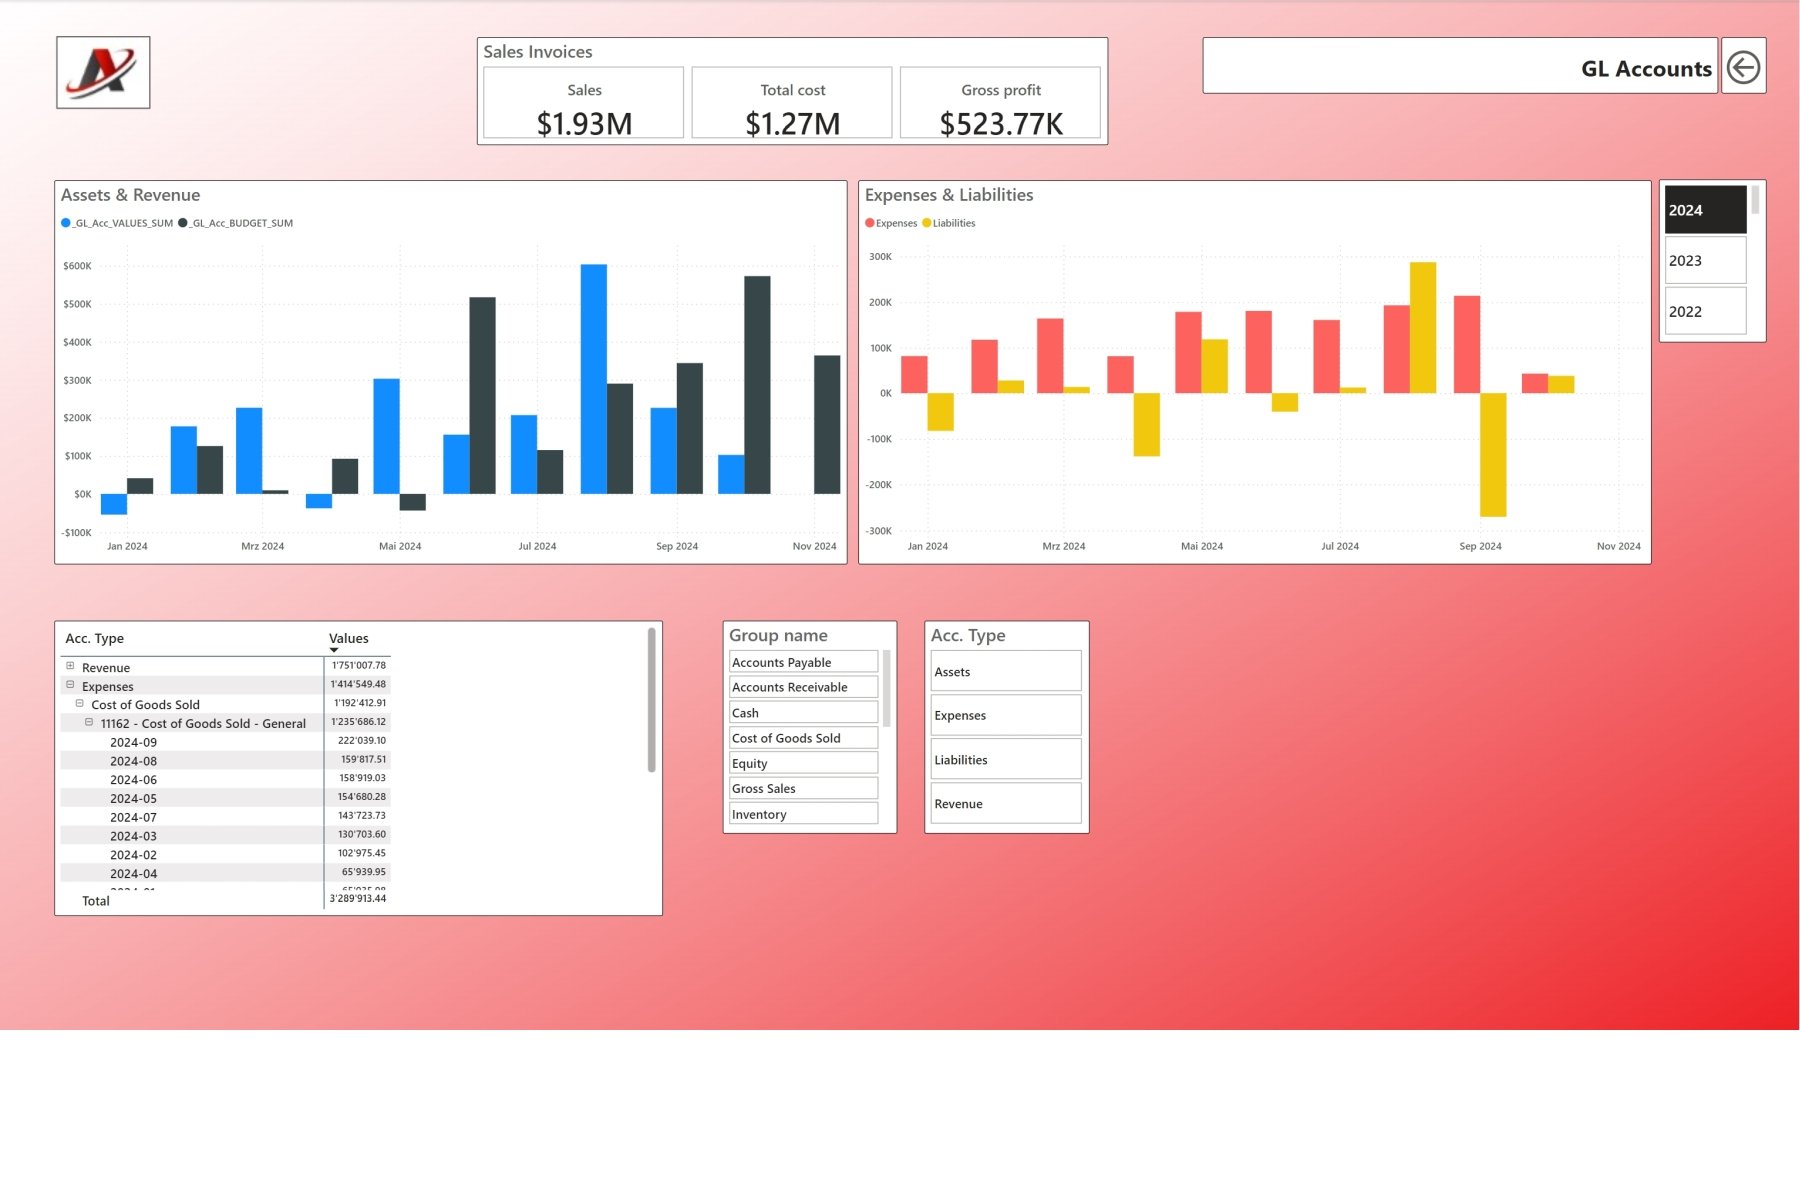
The key figures in a sales report include total turnover, sales volume and profit generated.
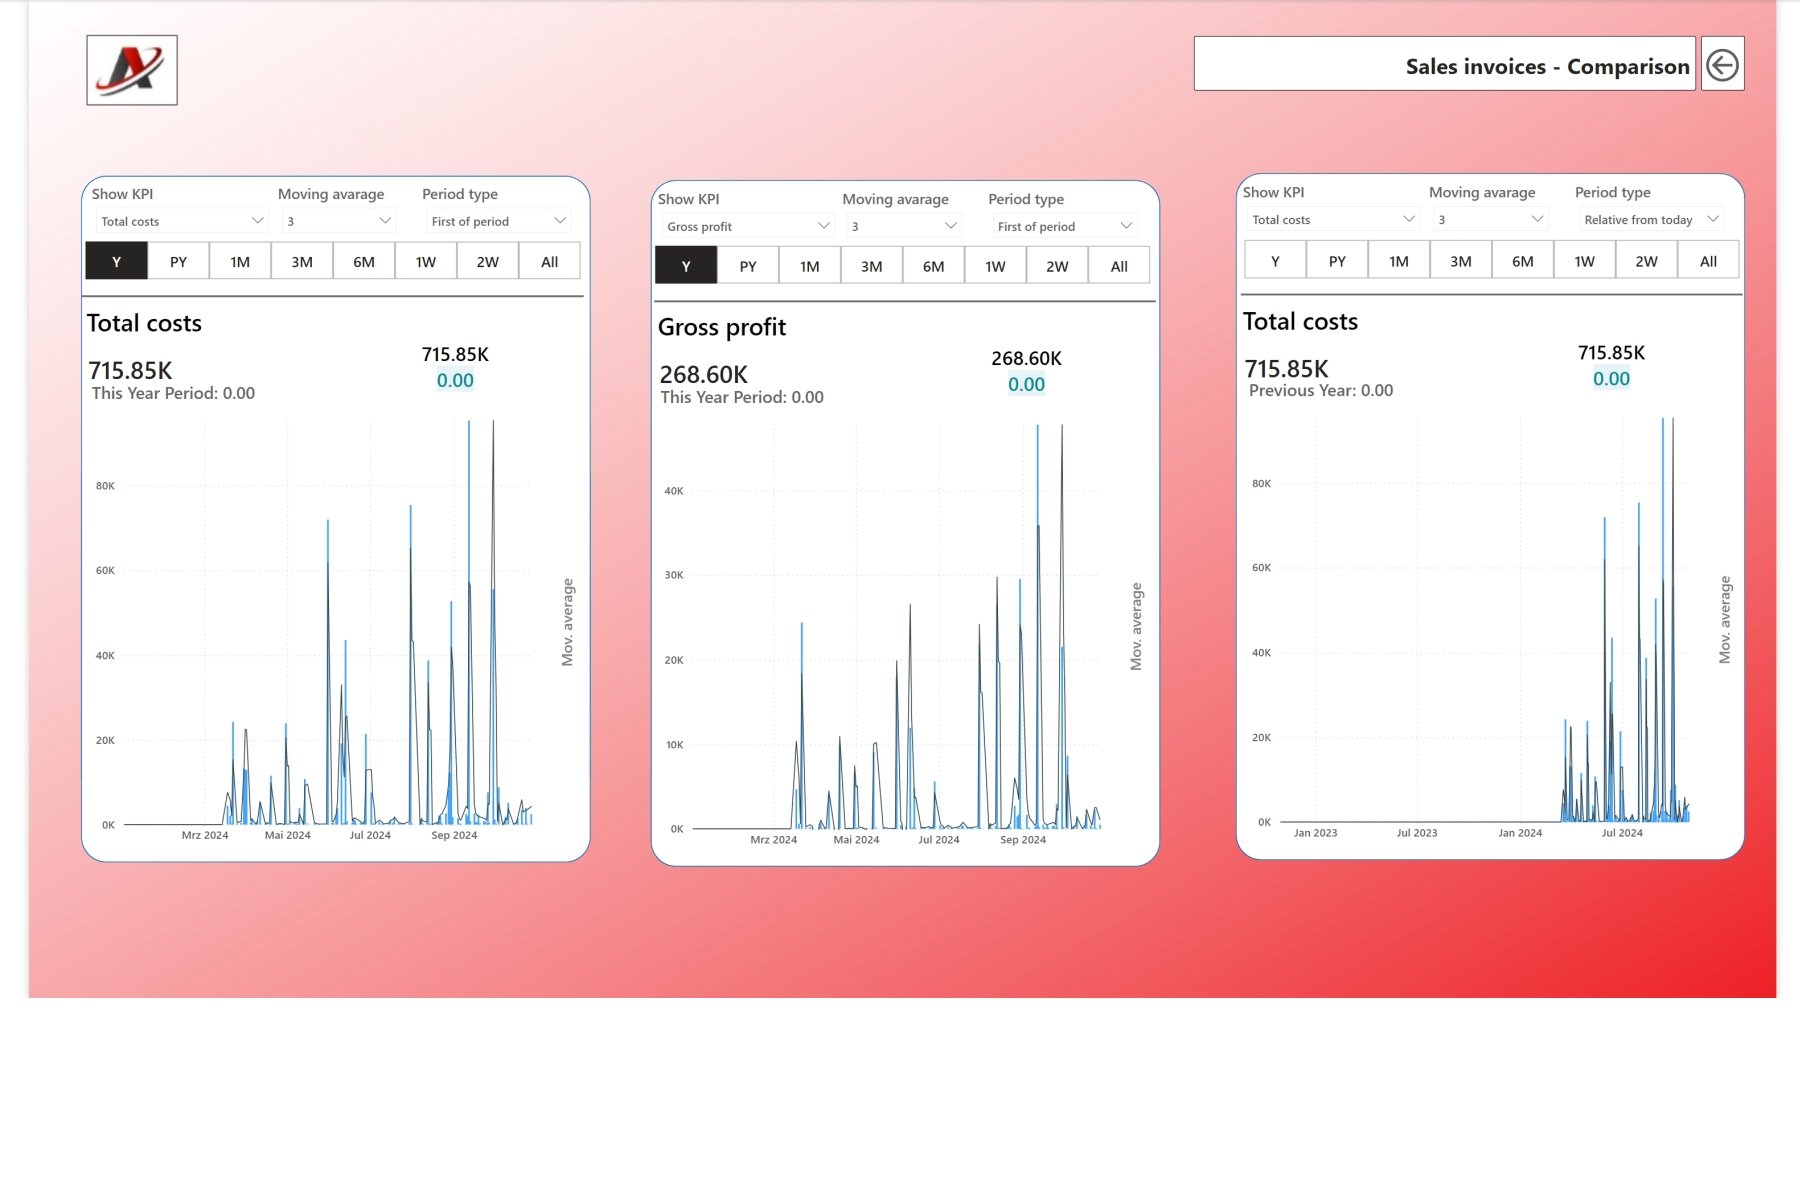
These key figures can be displayed according to standard time periods. The usual periods are year, quarter, month, week or day. The respective comparison periods (previous year, same quarter last year, etc.) from the past can also be used.
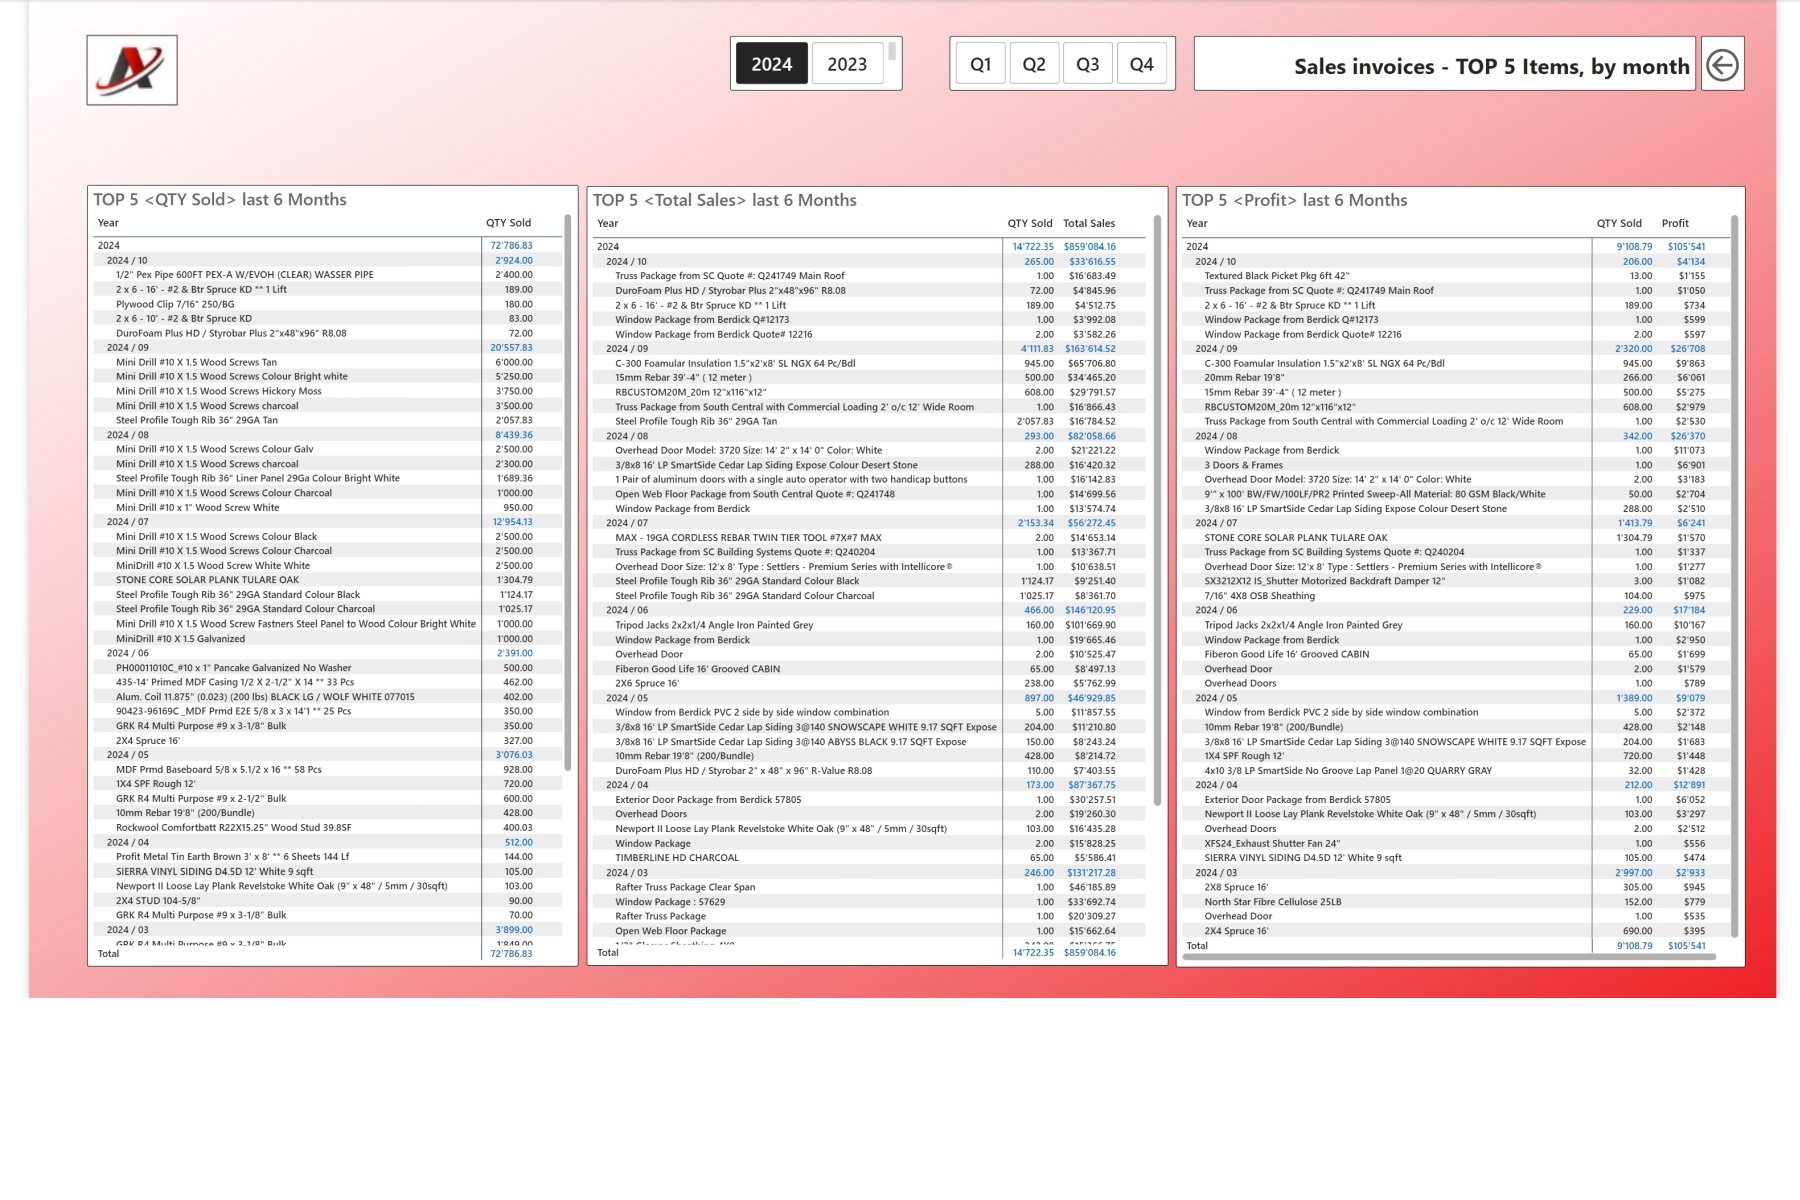
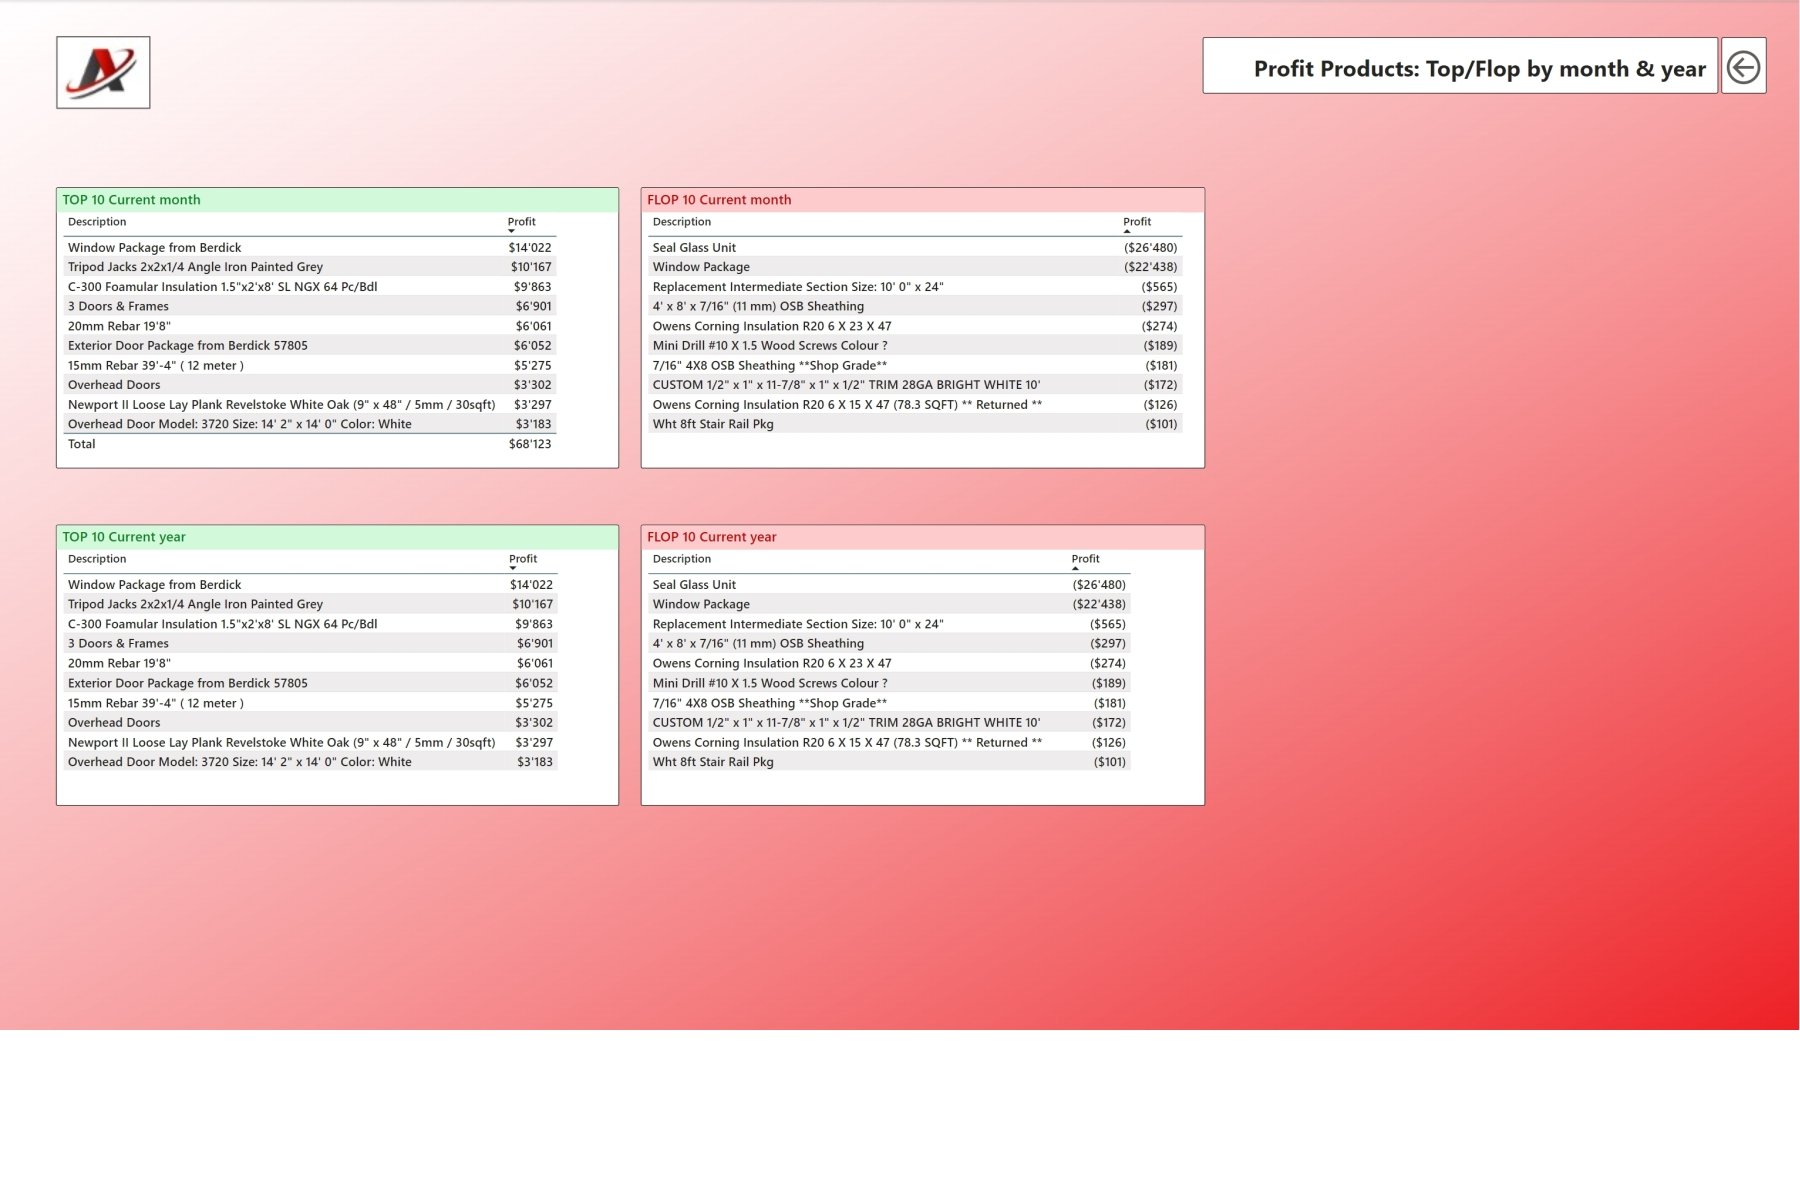
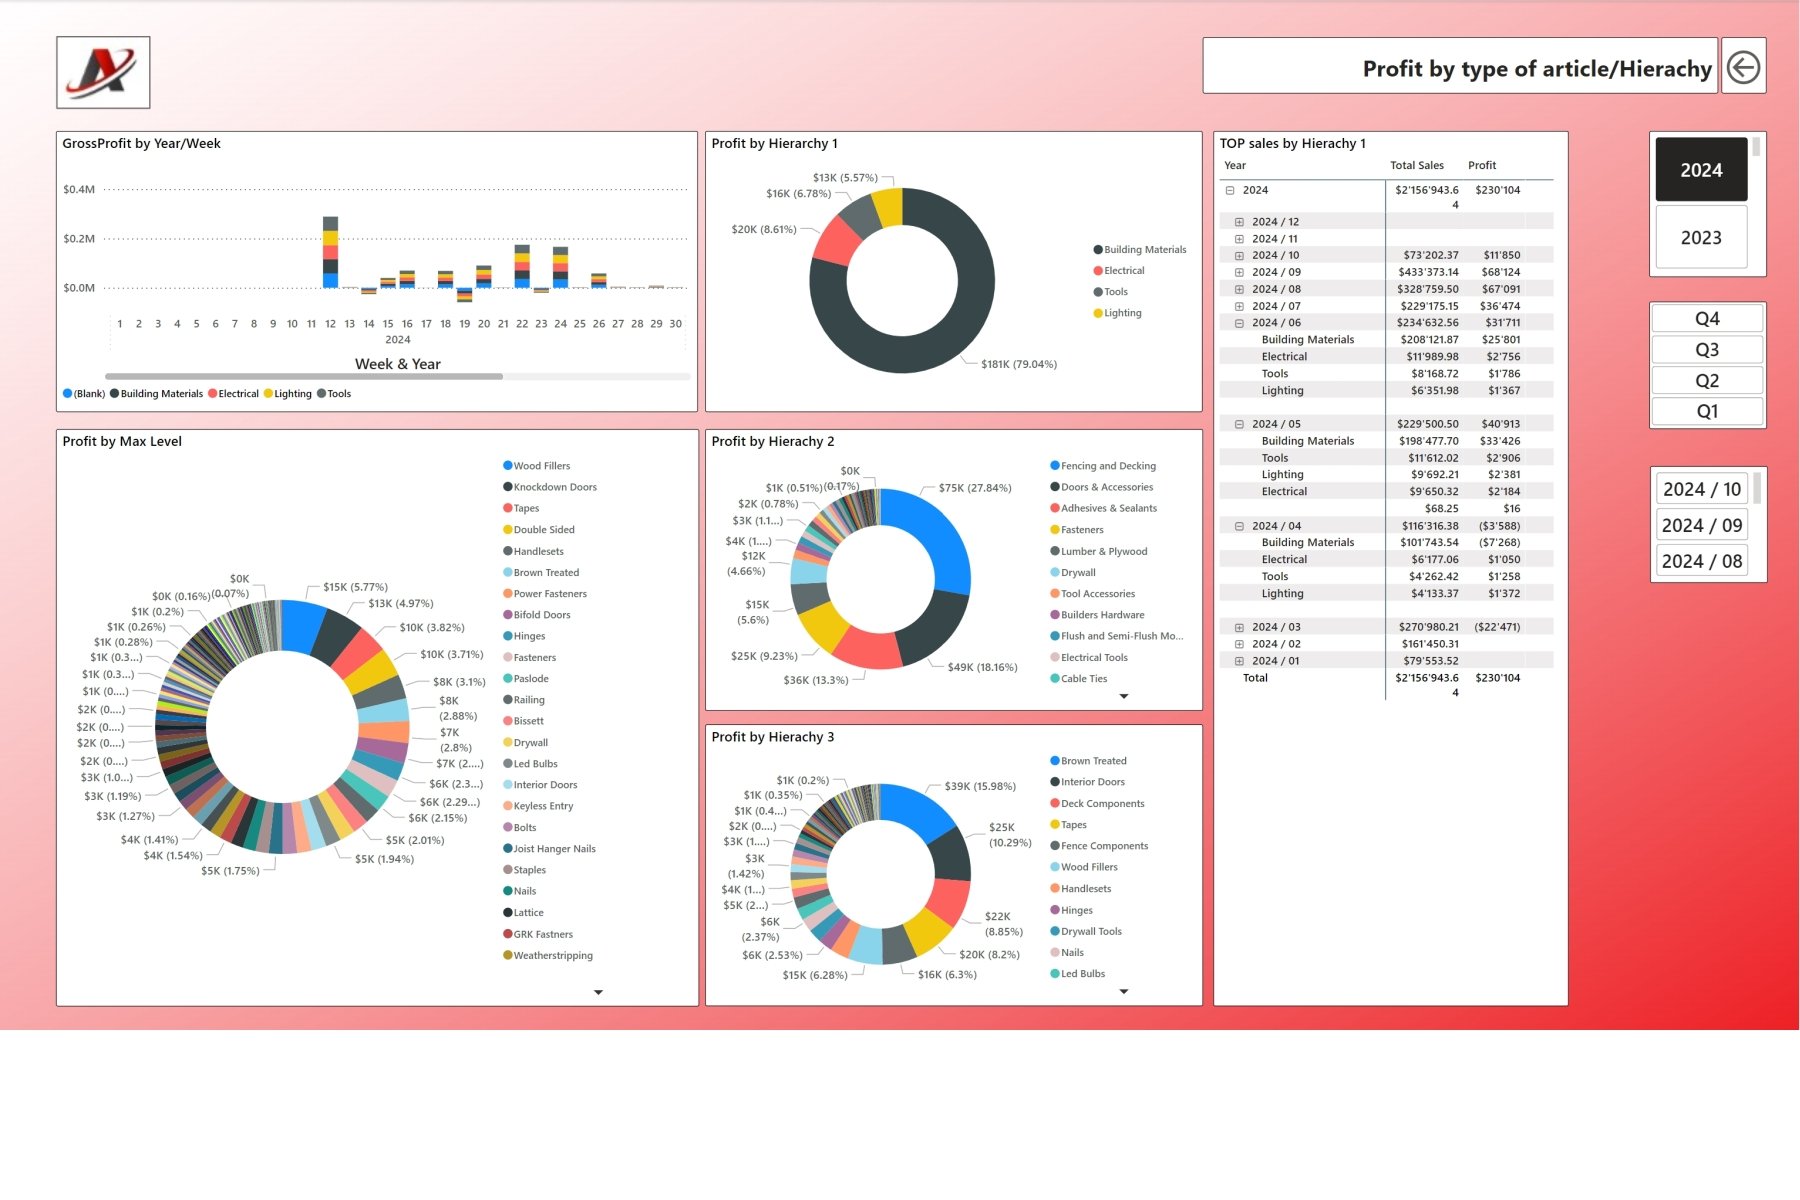
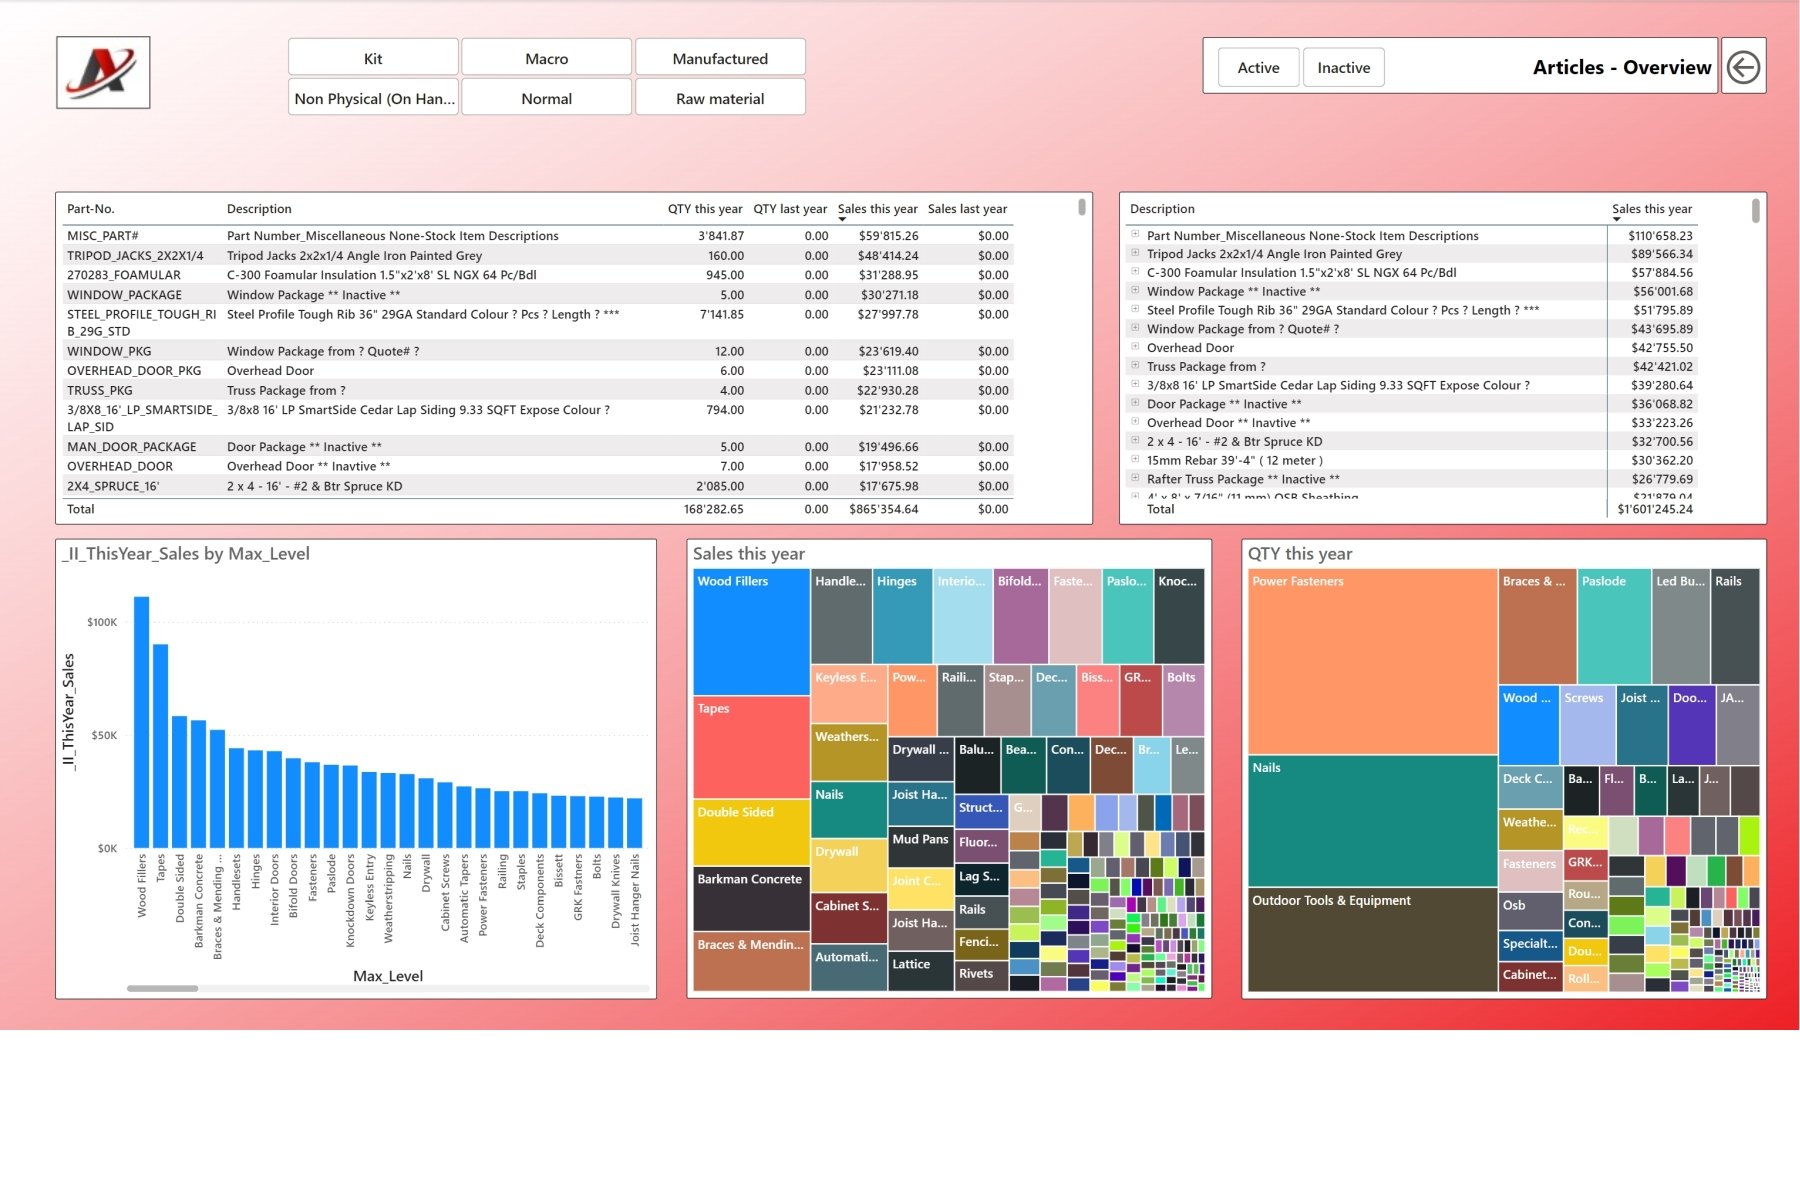
These figures can be broken down by product category or other categories that are important for the business model in order to obtain a detailed view of the individual sales segments.
3. Presentation of key figures
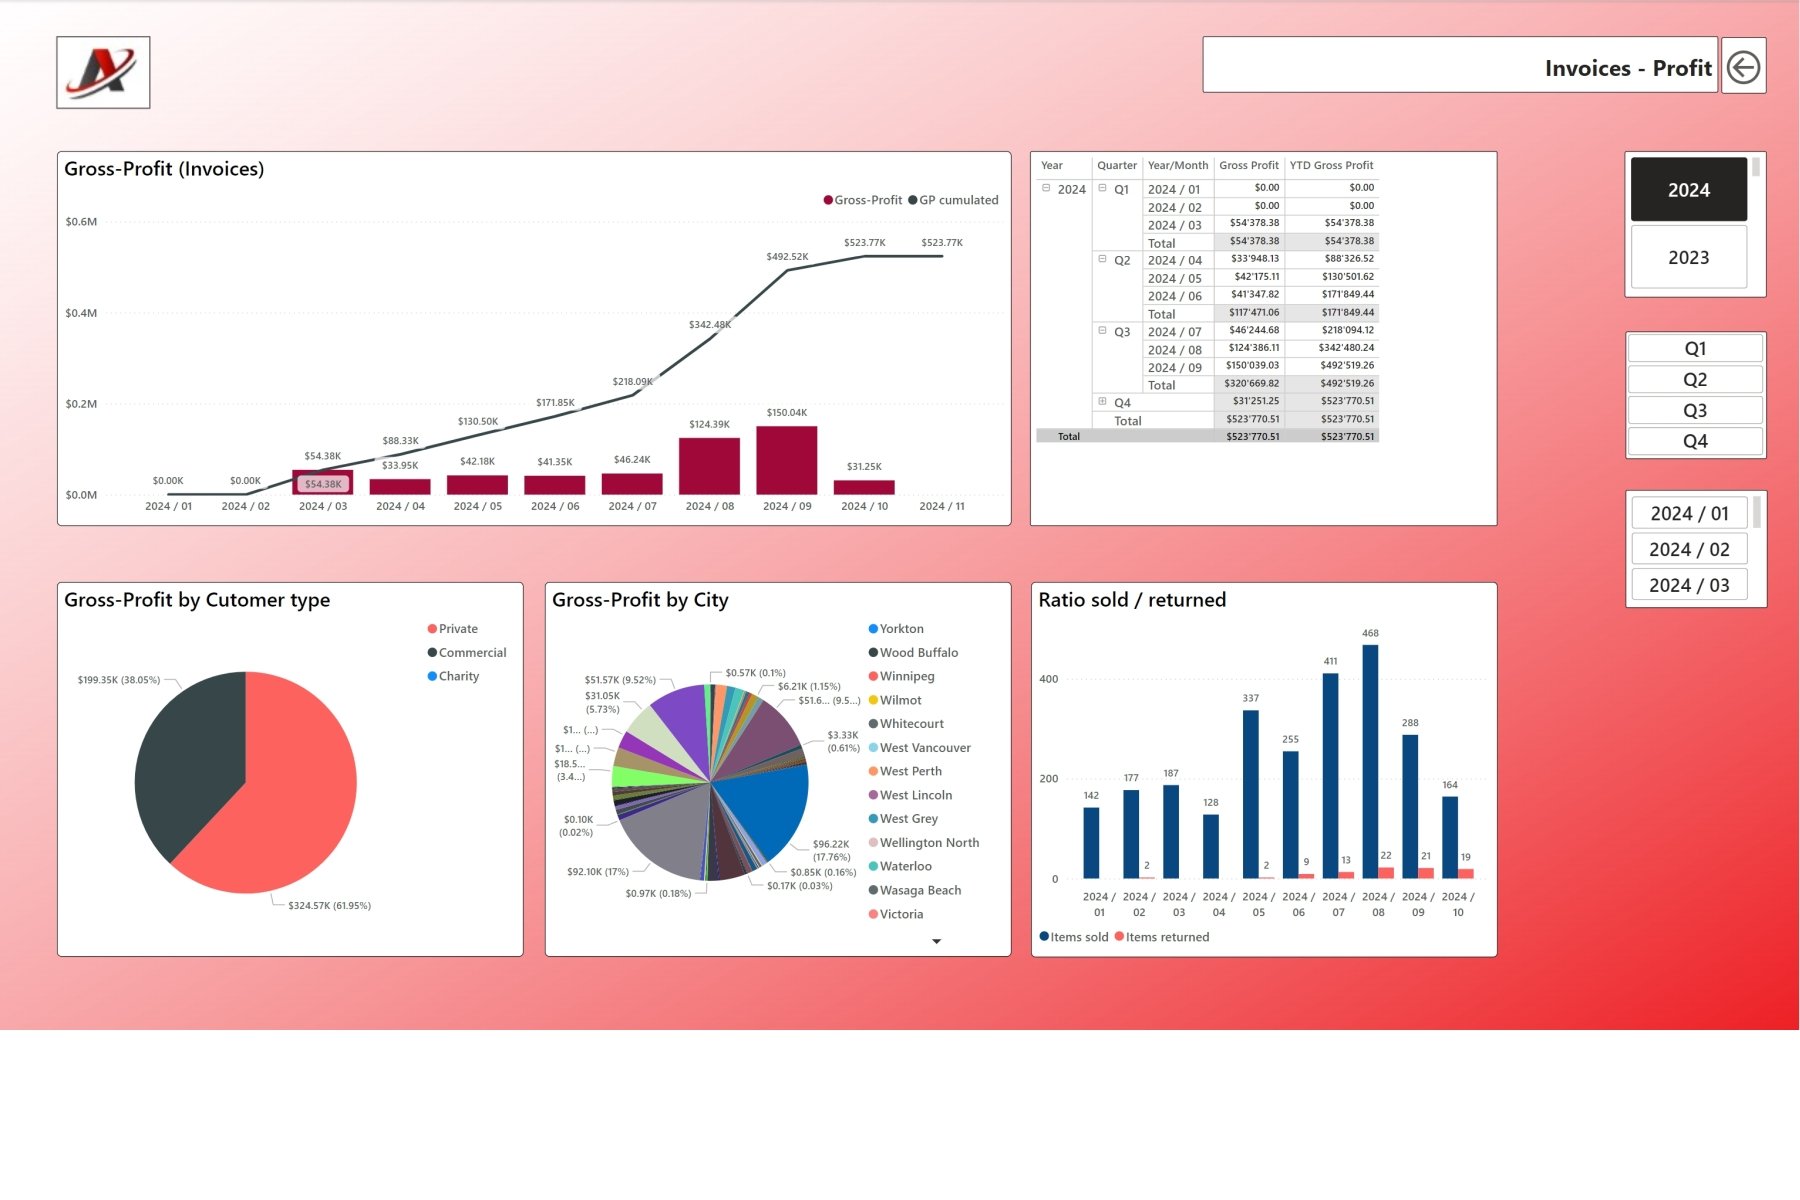
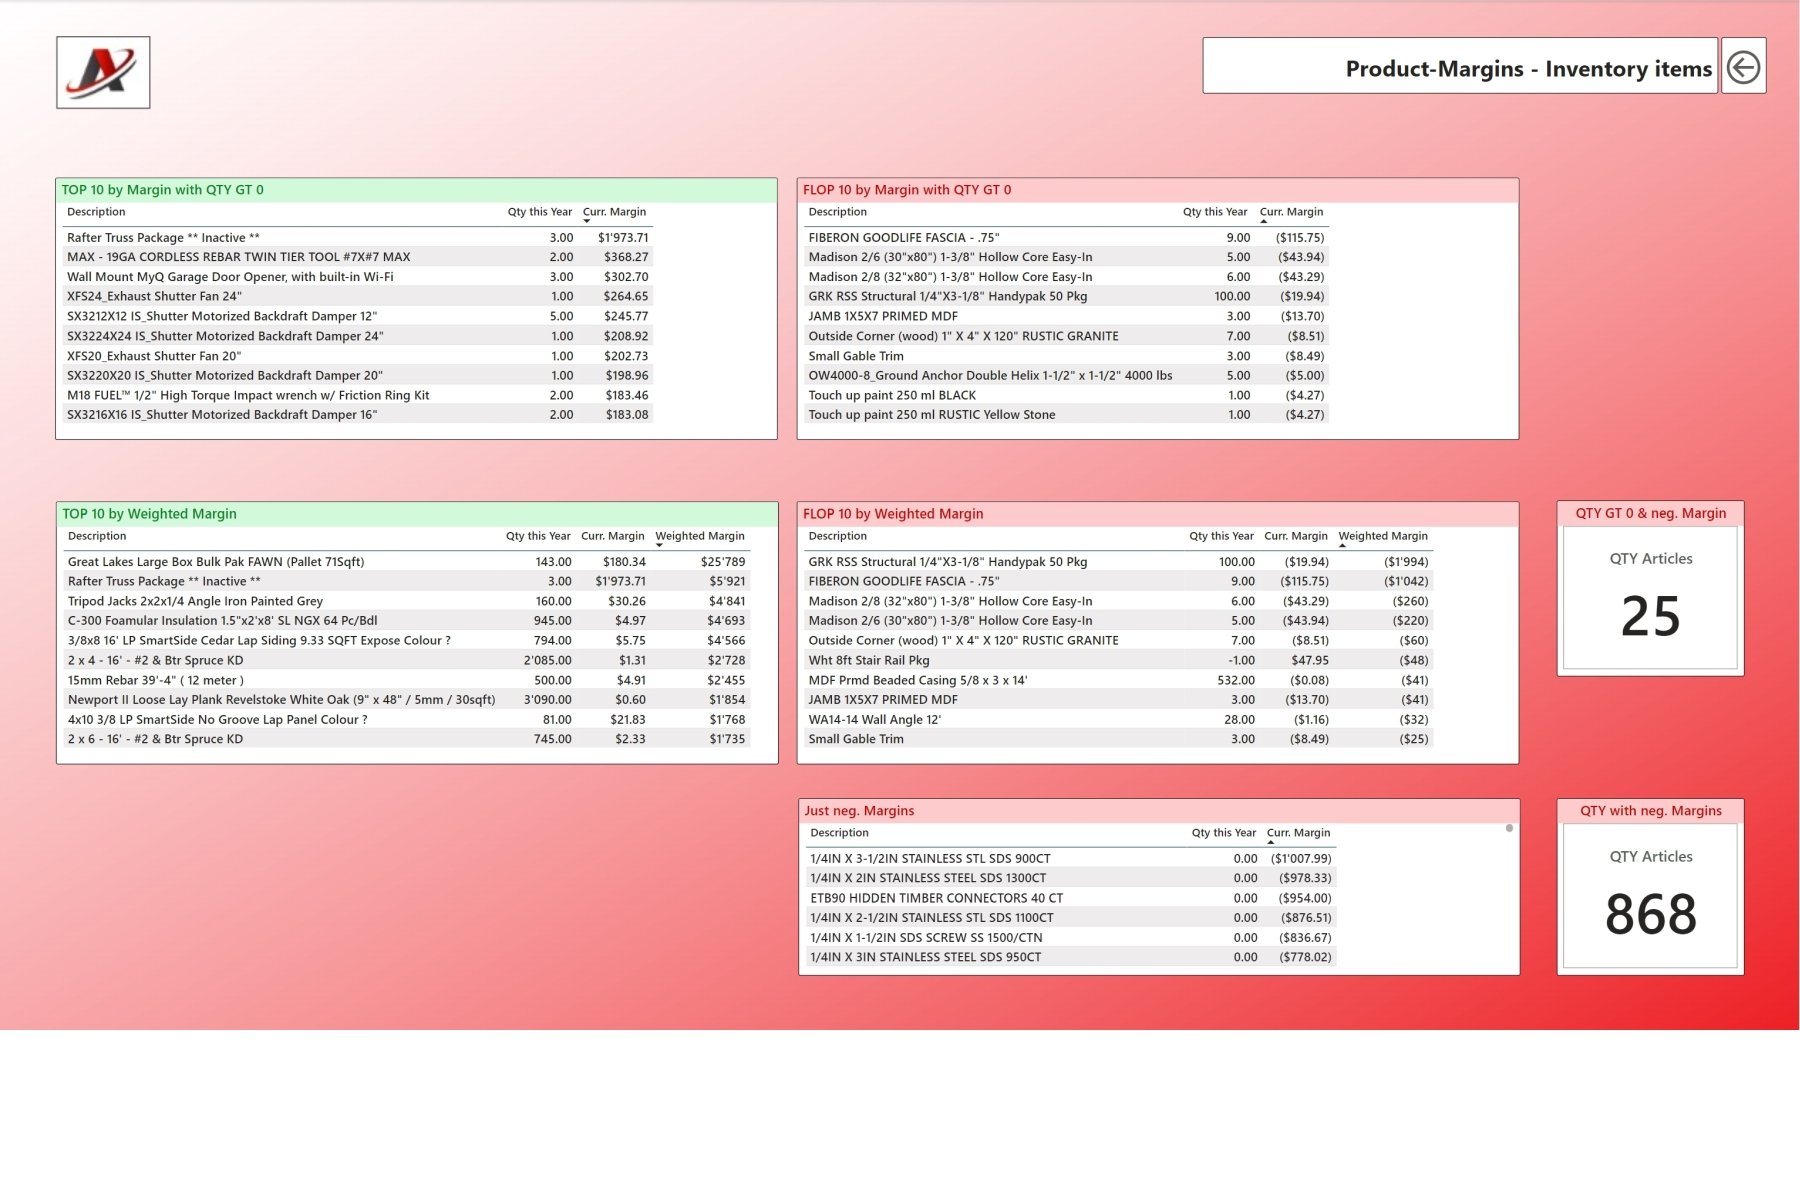
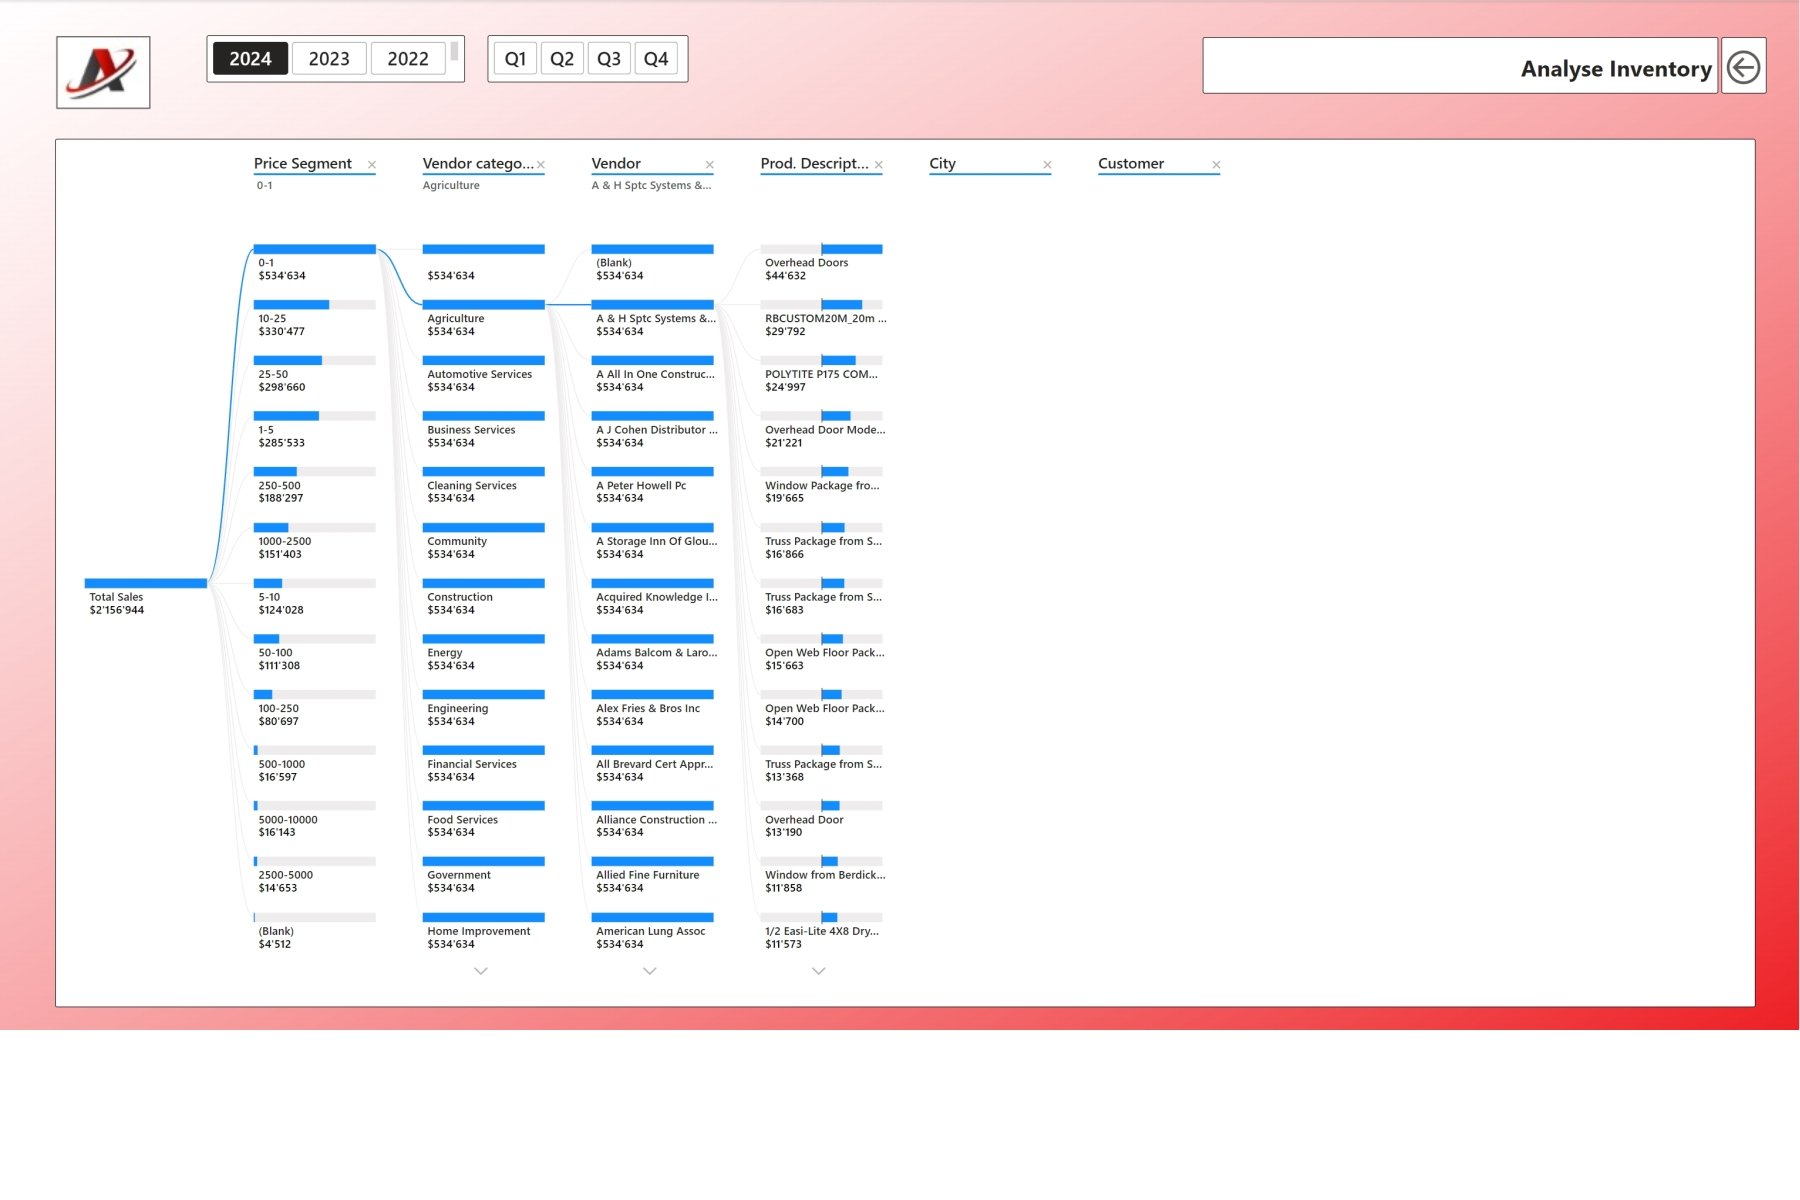
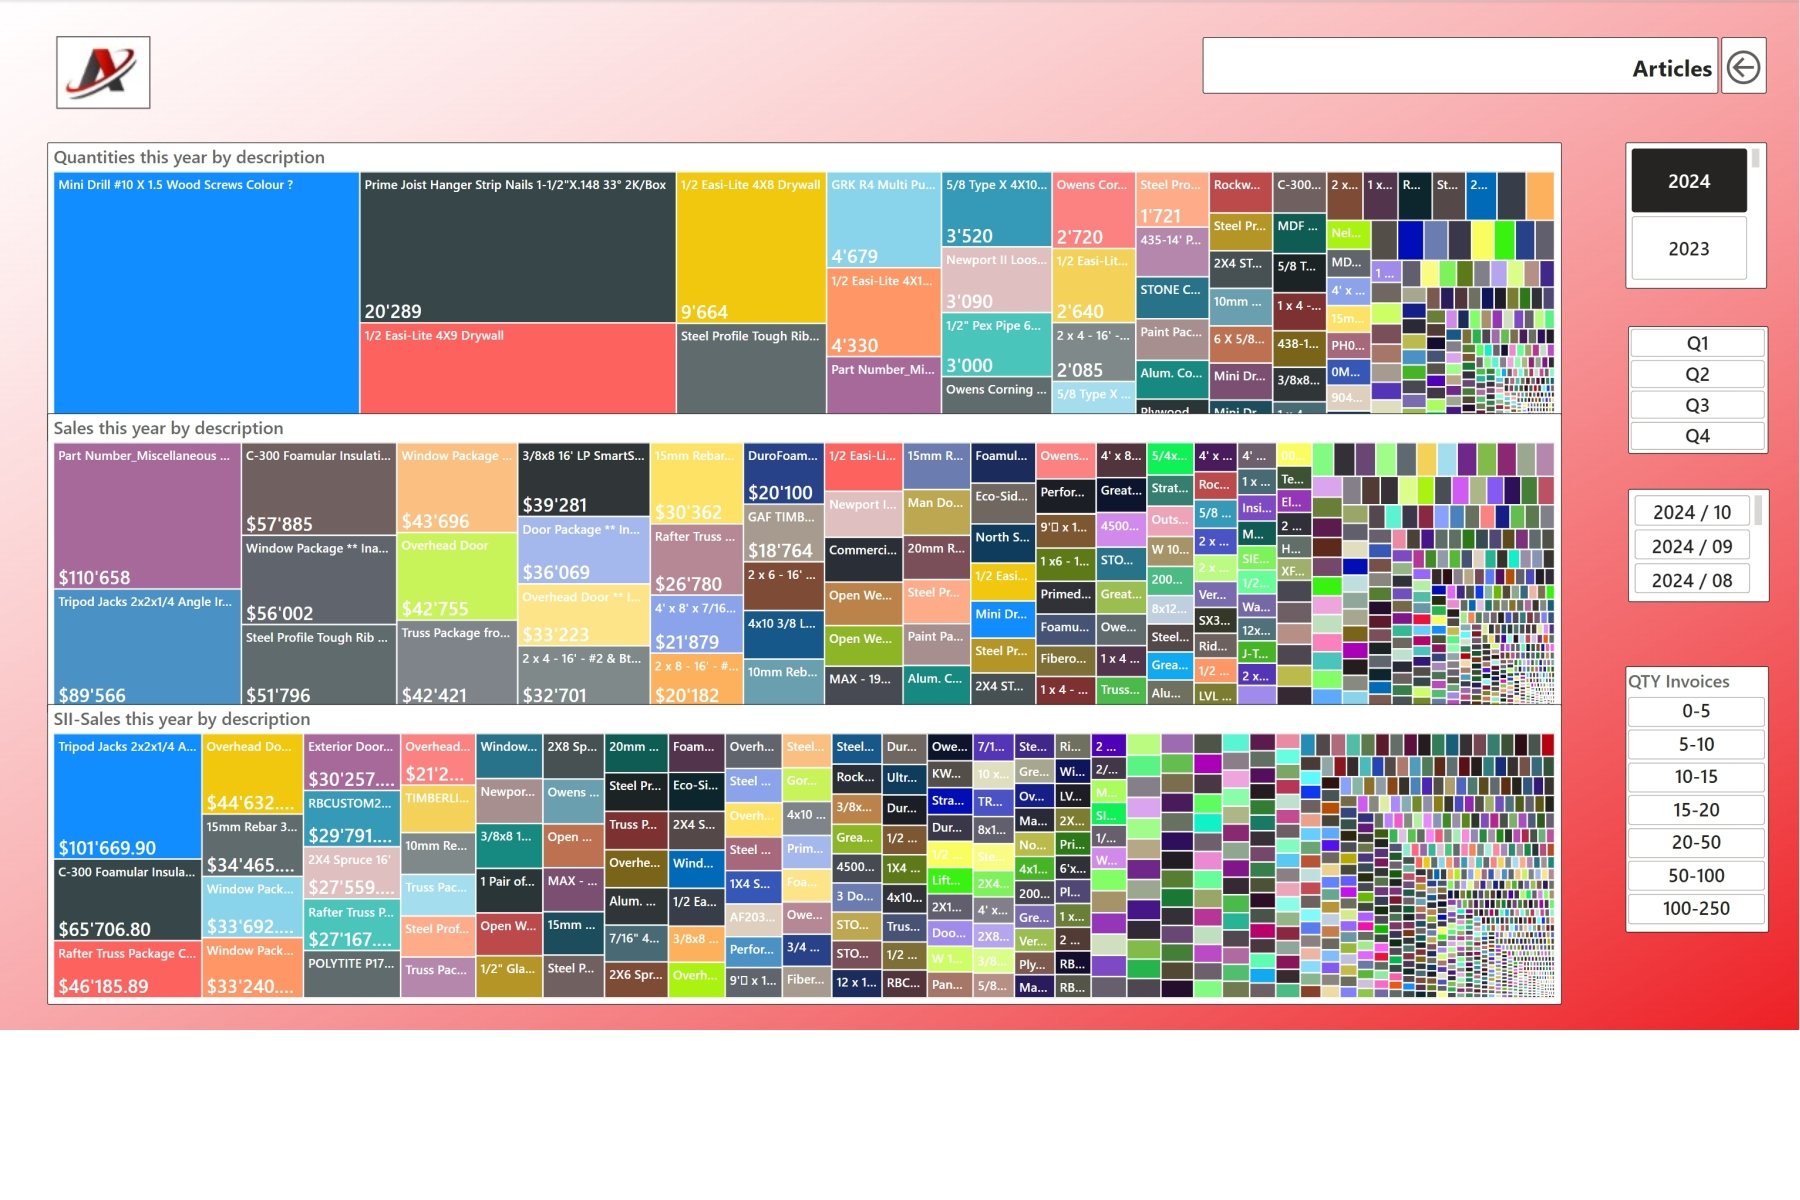
A builders' merchant usually offers a wide range of products, which can be divided into various categories. The sales of these categories, in turn, can be displayed according to many criteria: Customer types, regions, etc.
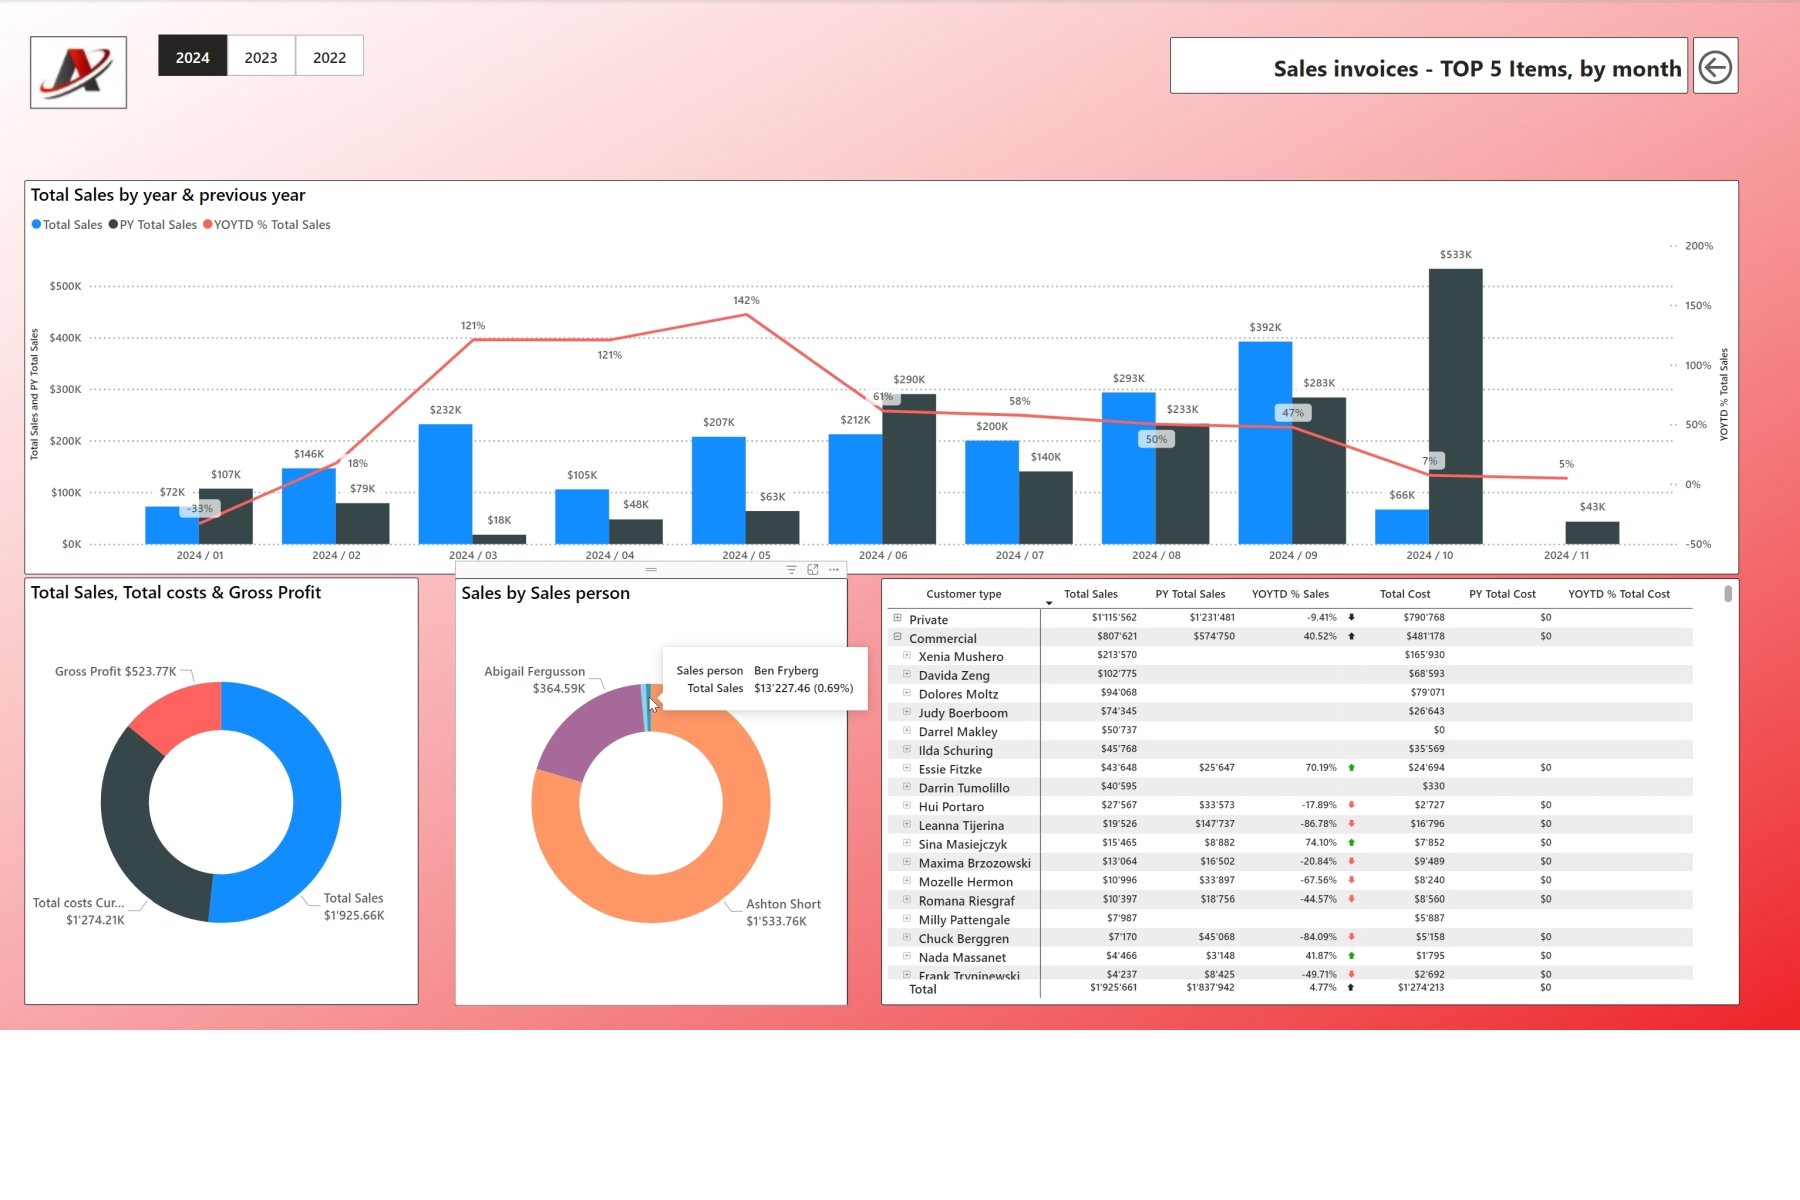
4. Sales development over the period
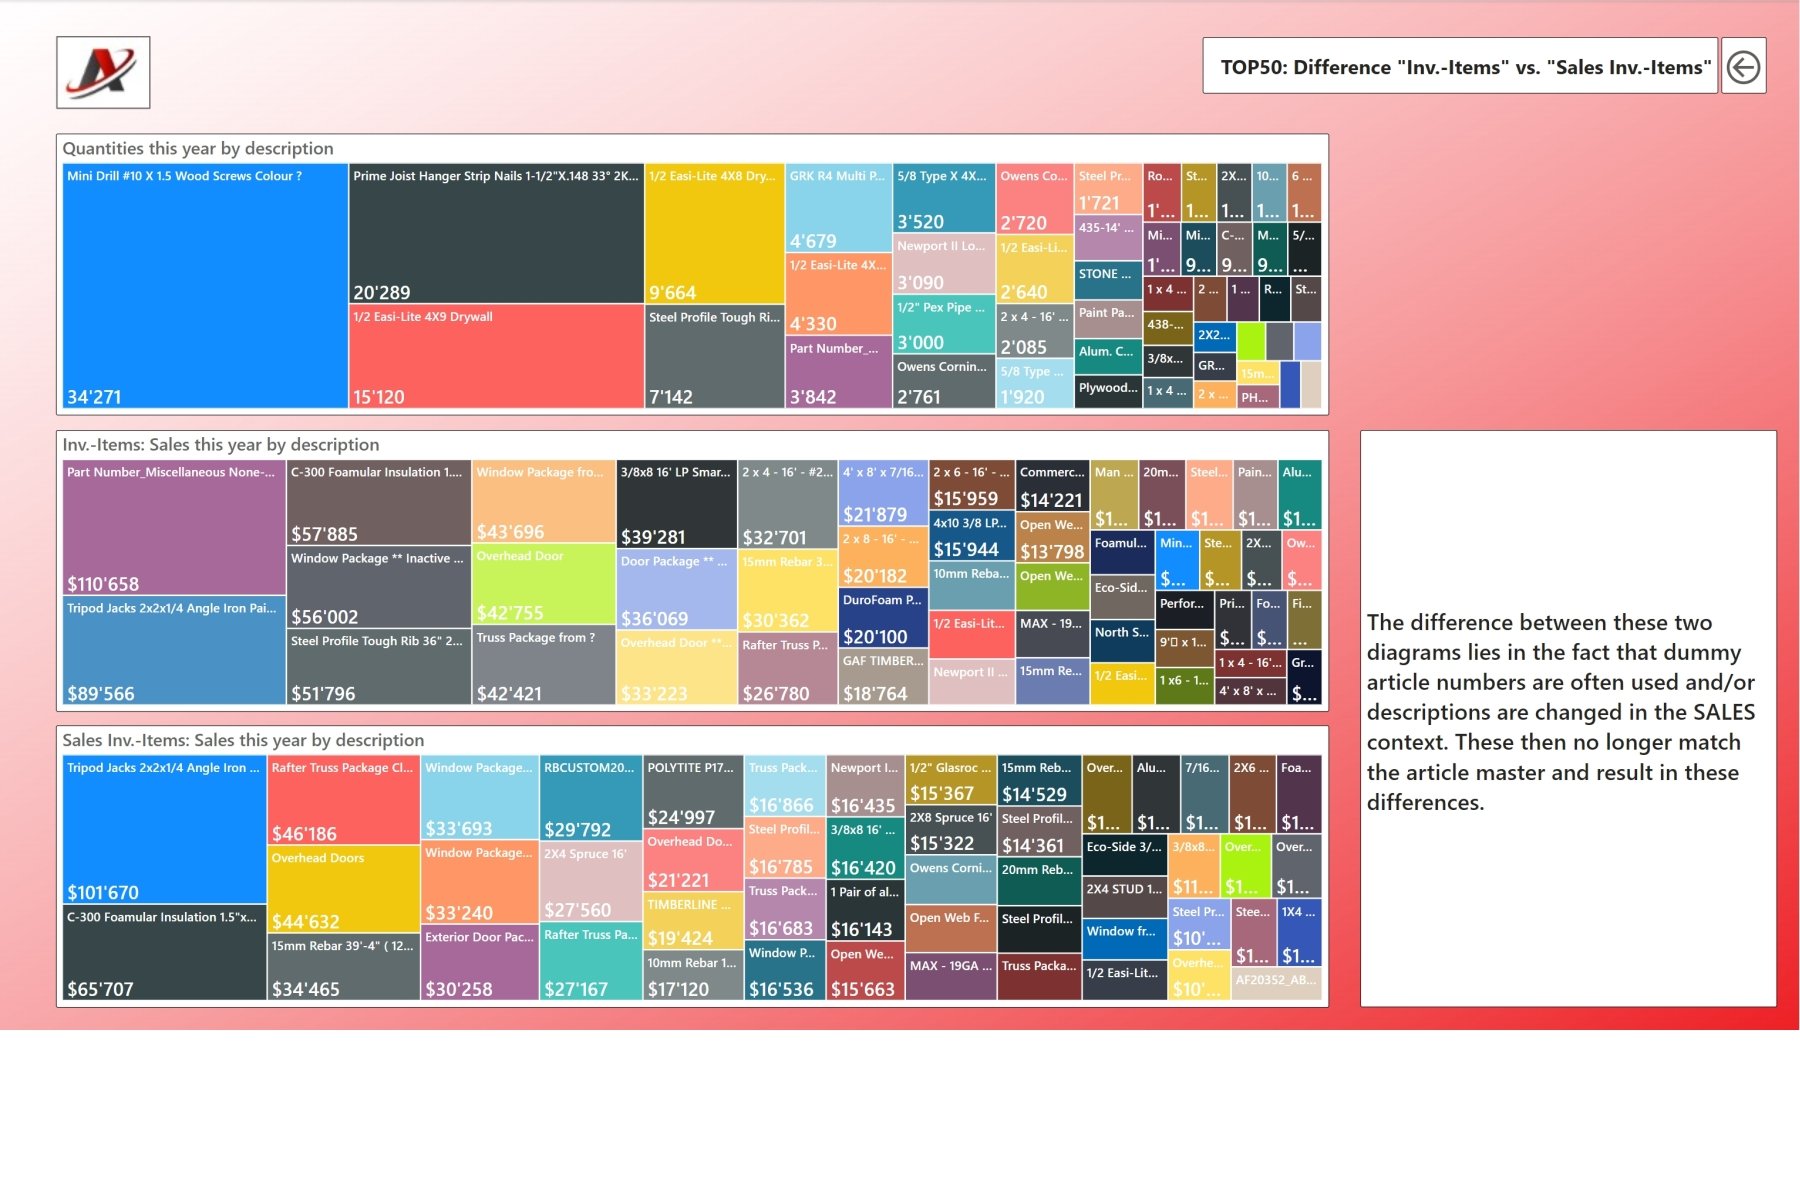
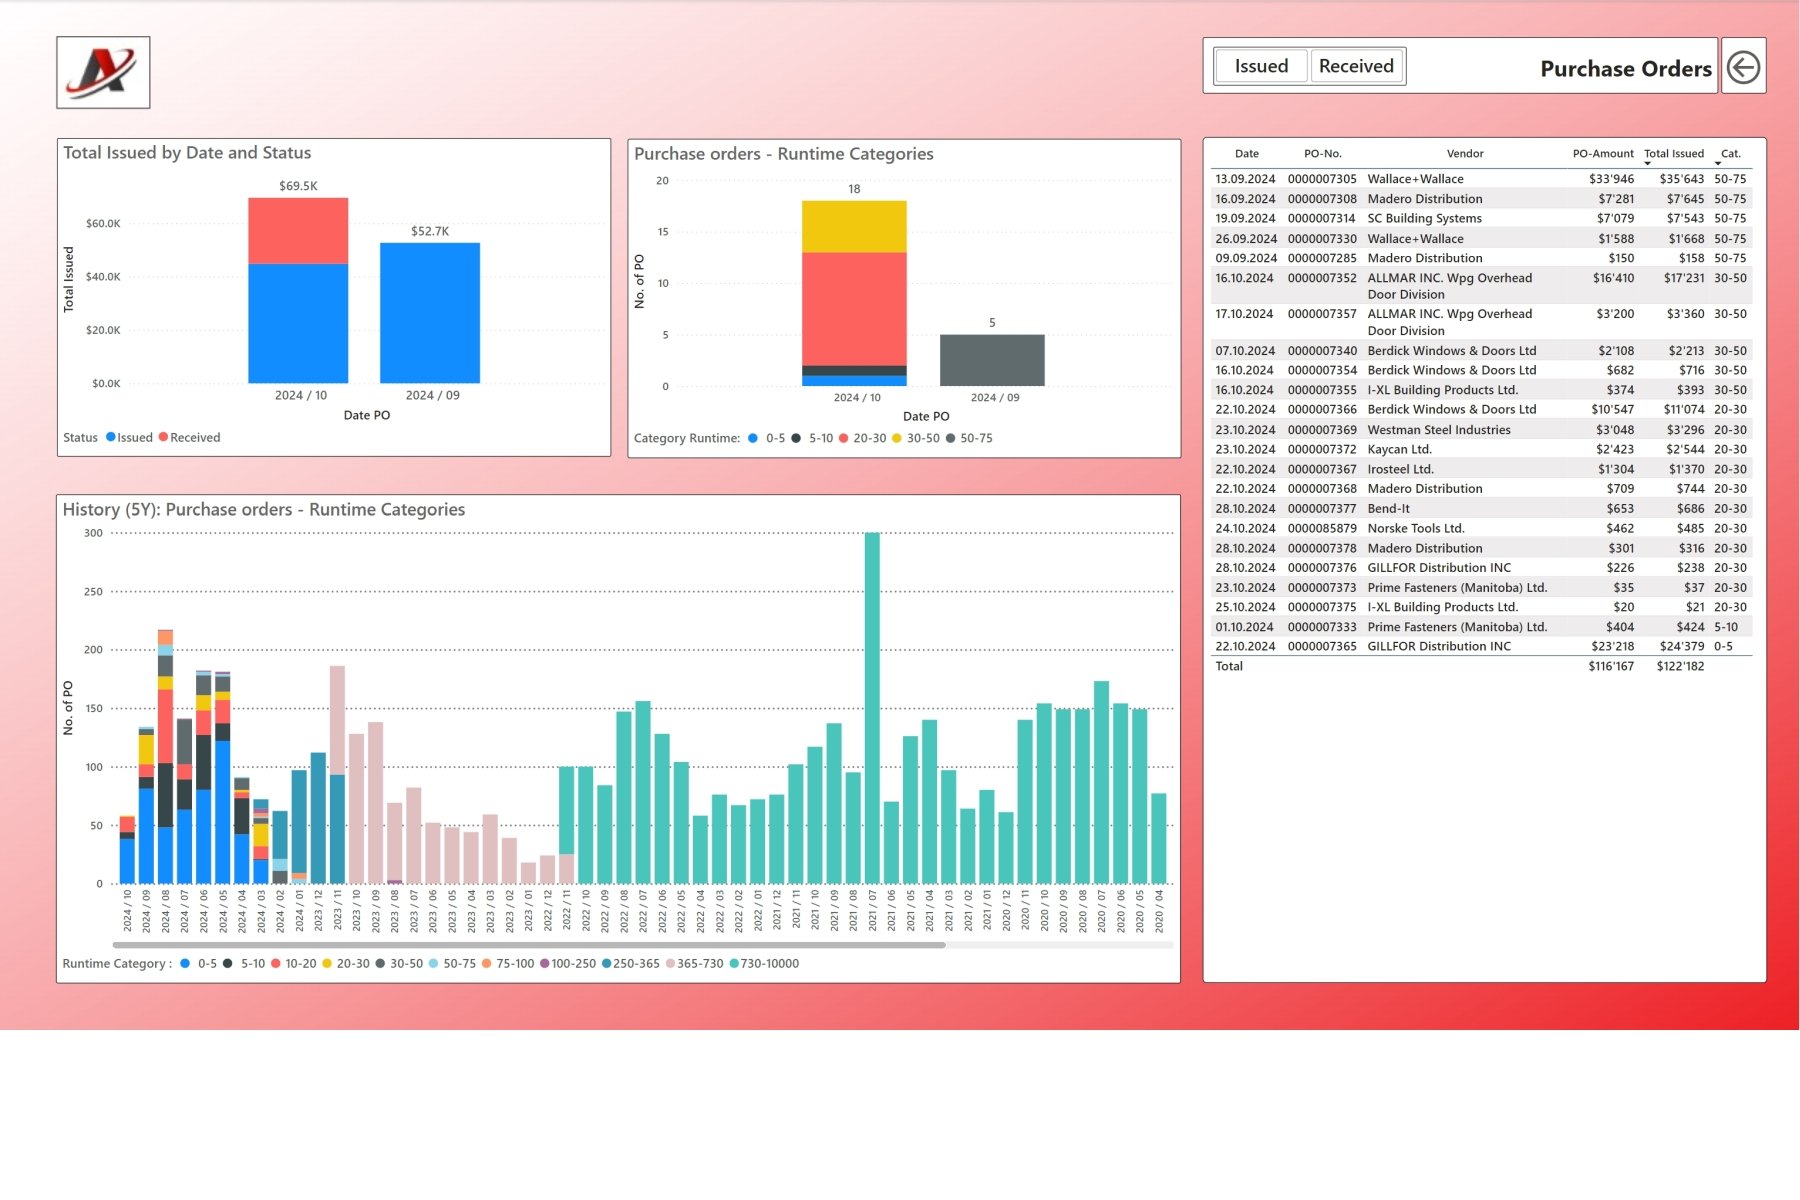
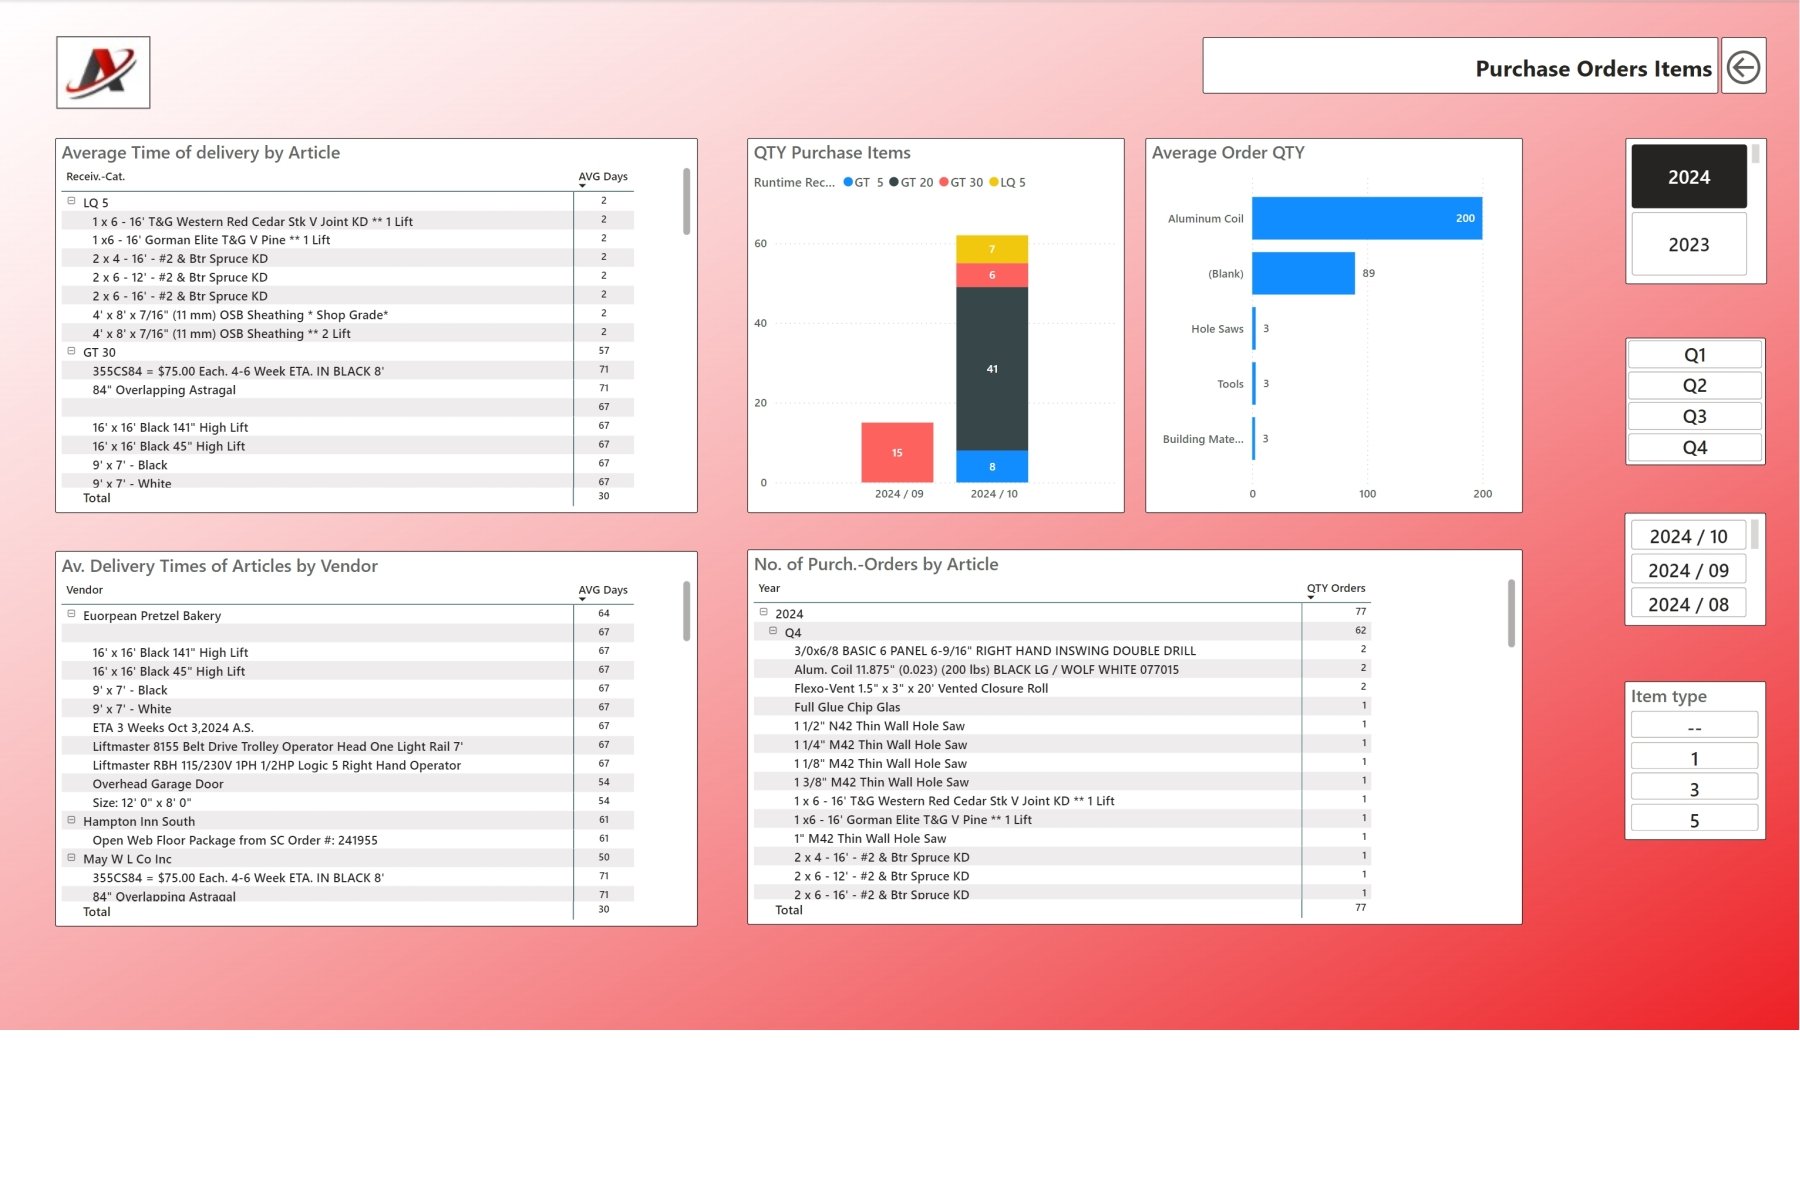
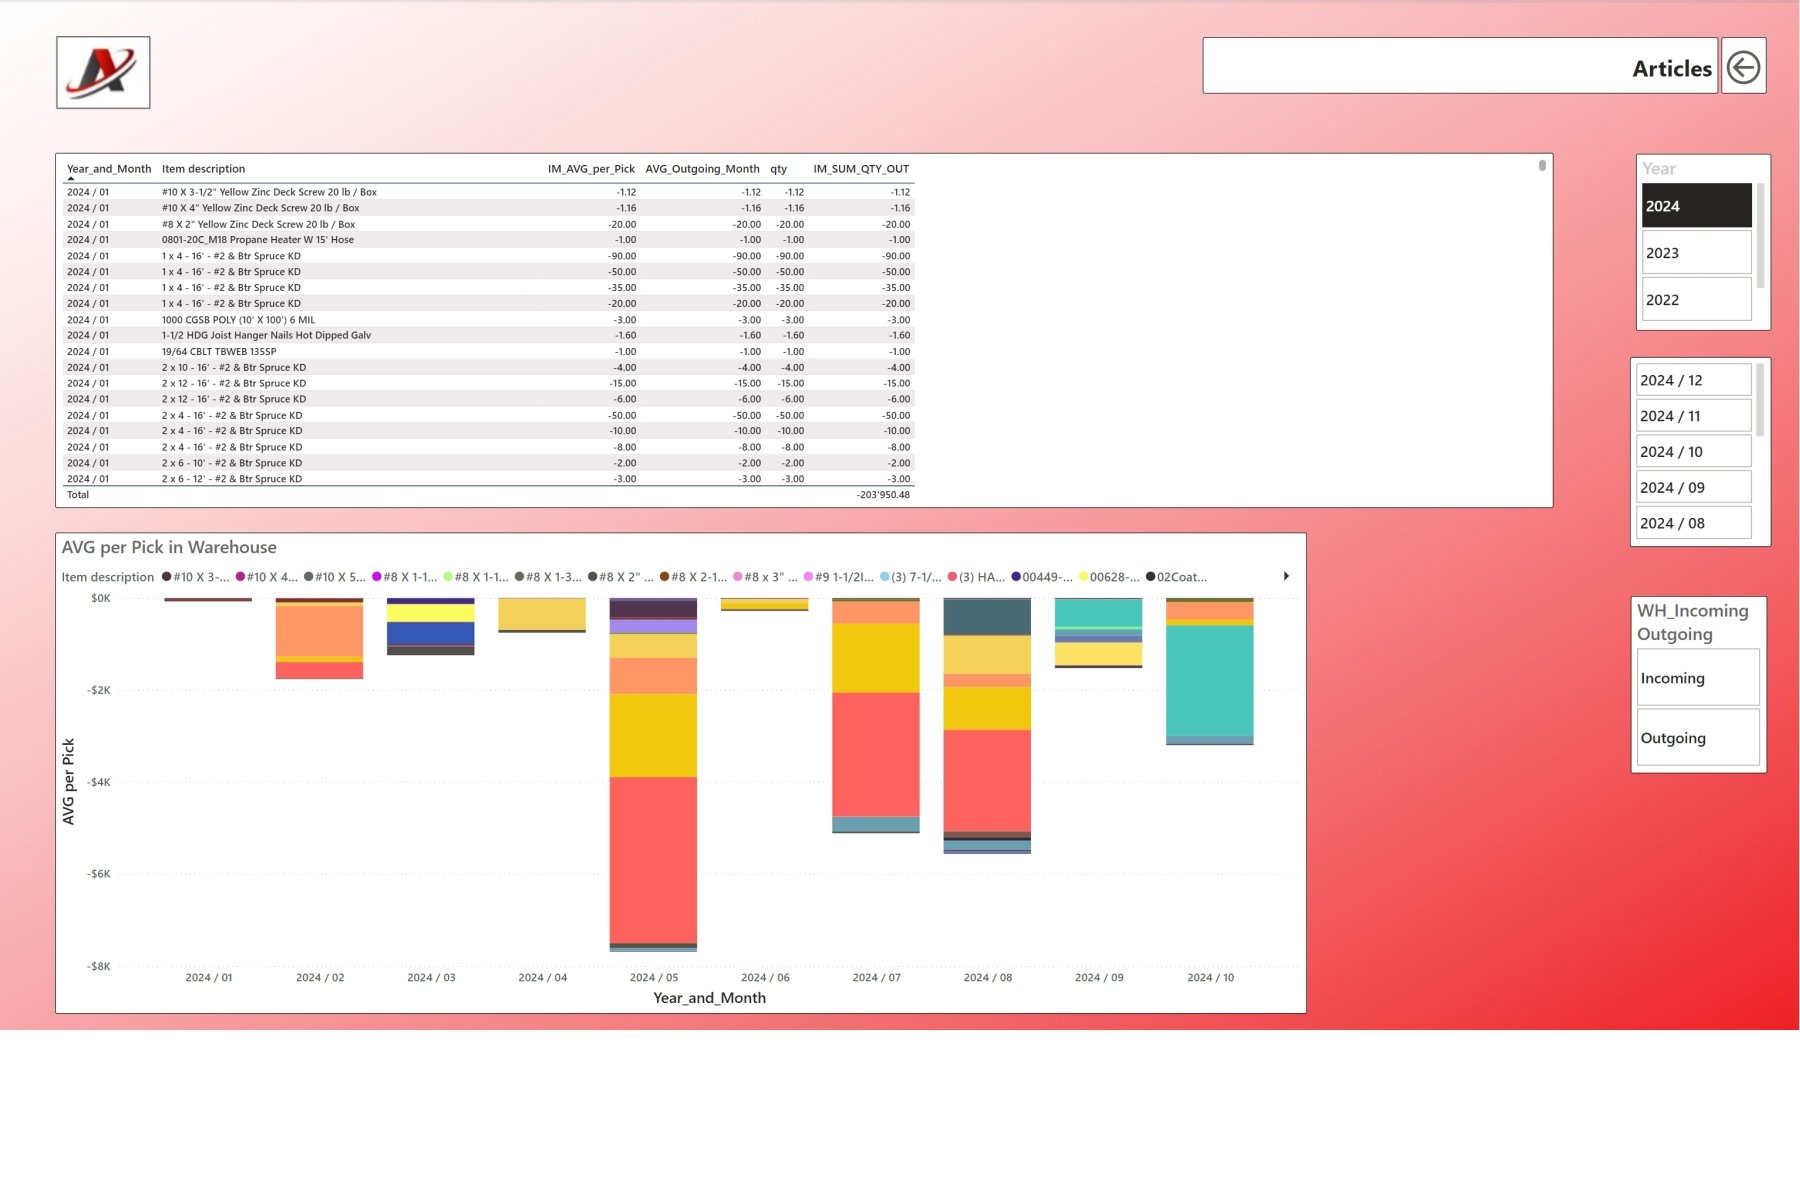
In addition to very information-heavy tabular representations, graphical representations are another essential element of a sales report. They allow sales figures to be analyzed quickly and visually.
Diagrams help to quickly grasp developments and draw appropriate conclusions.
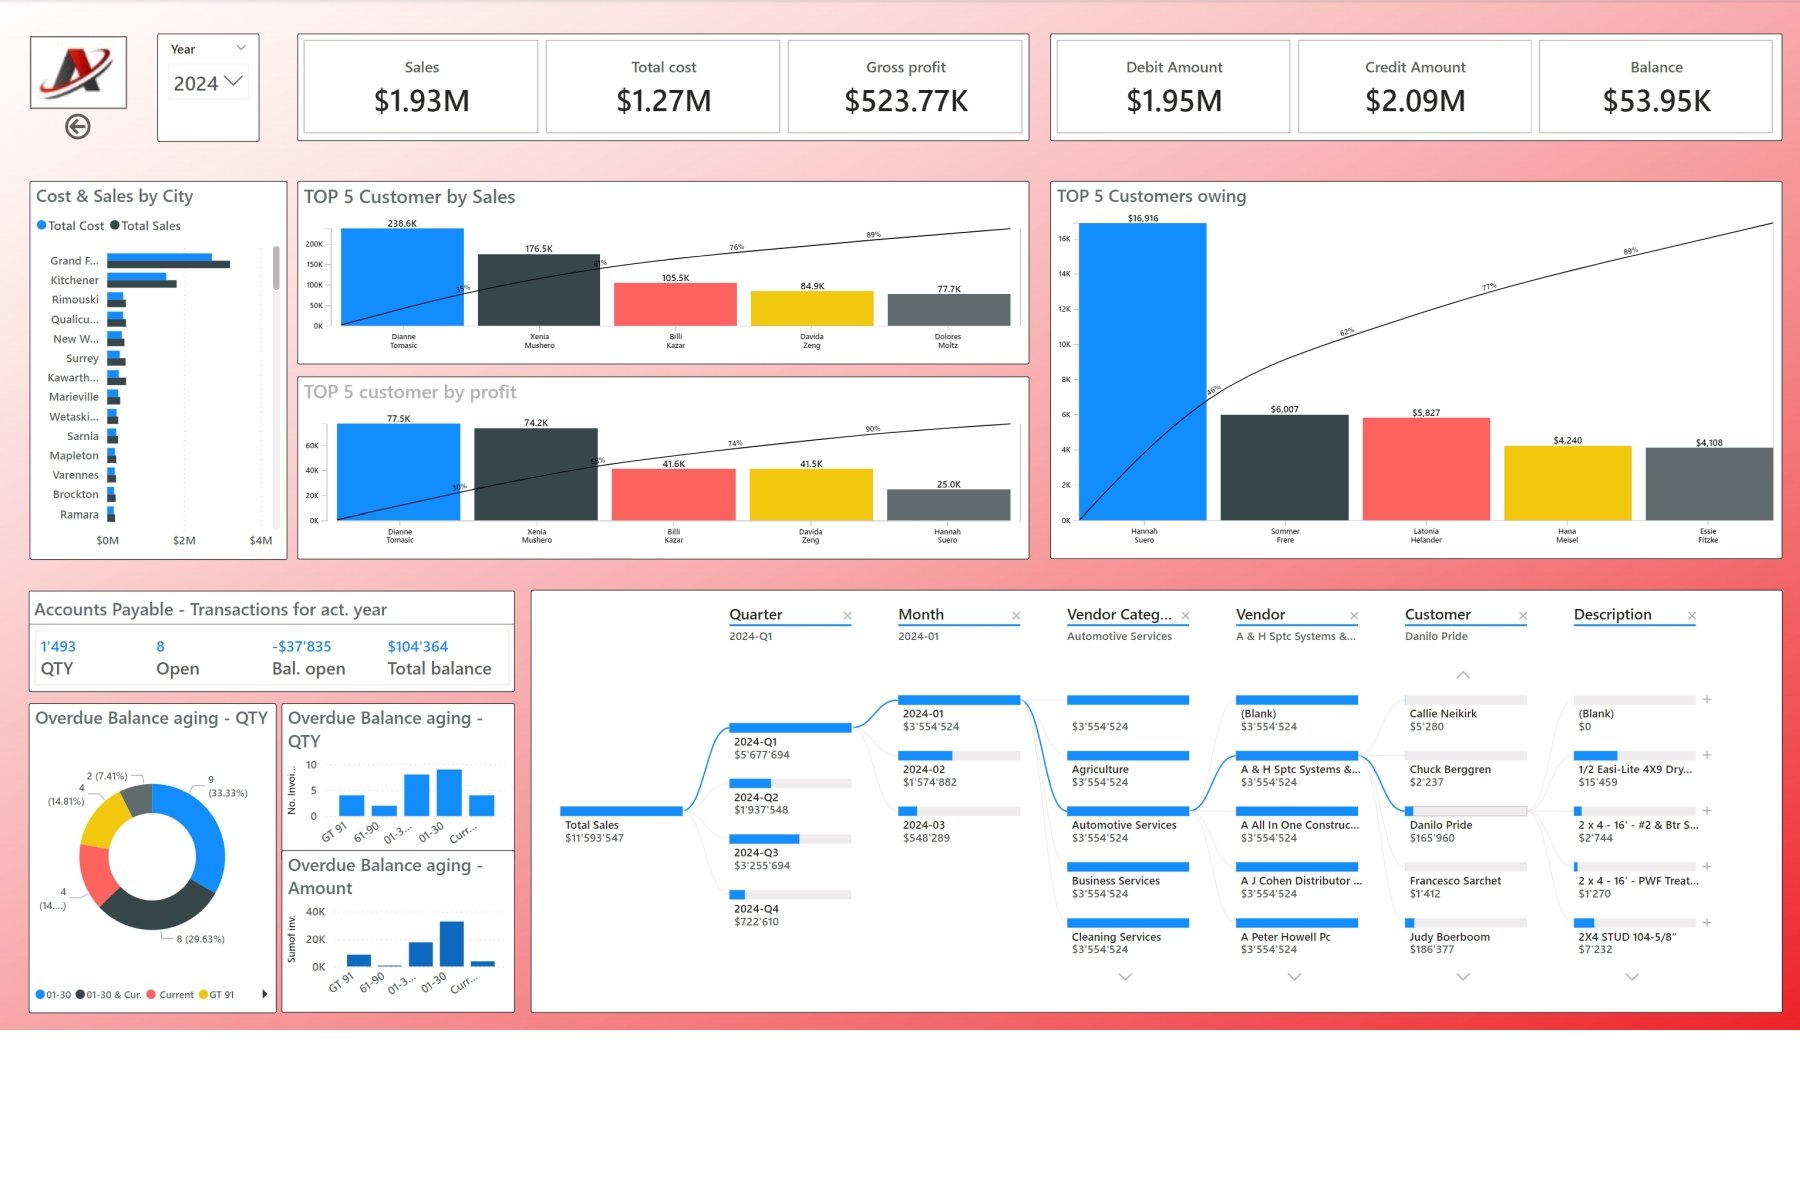
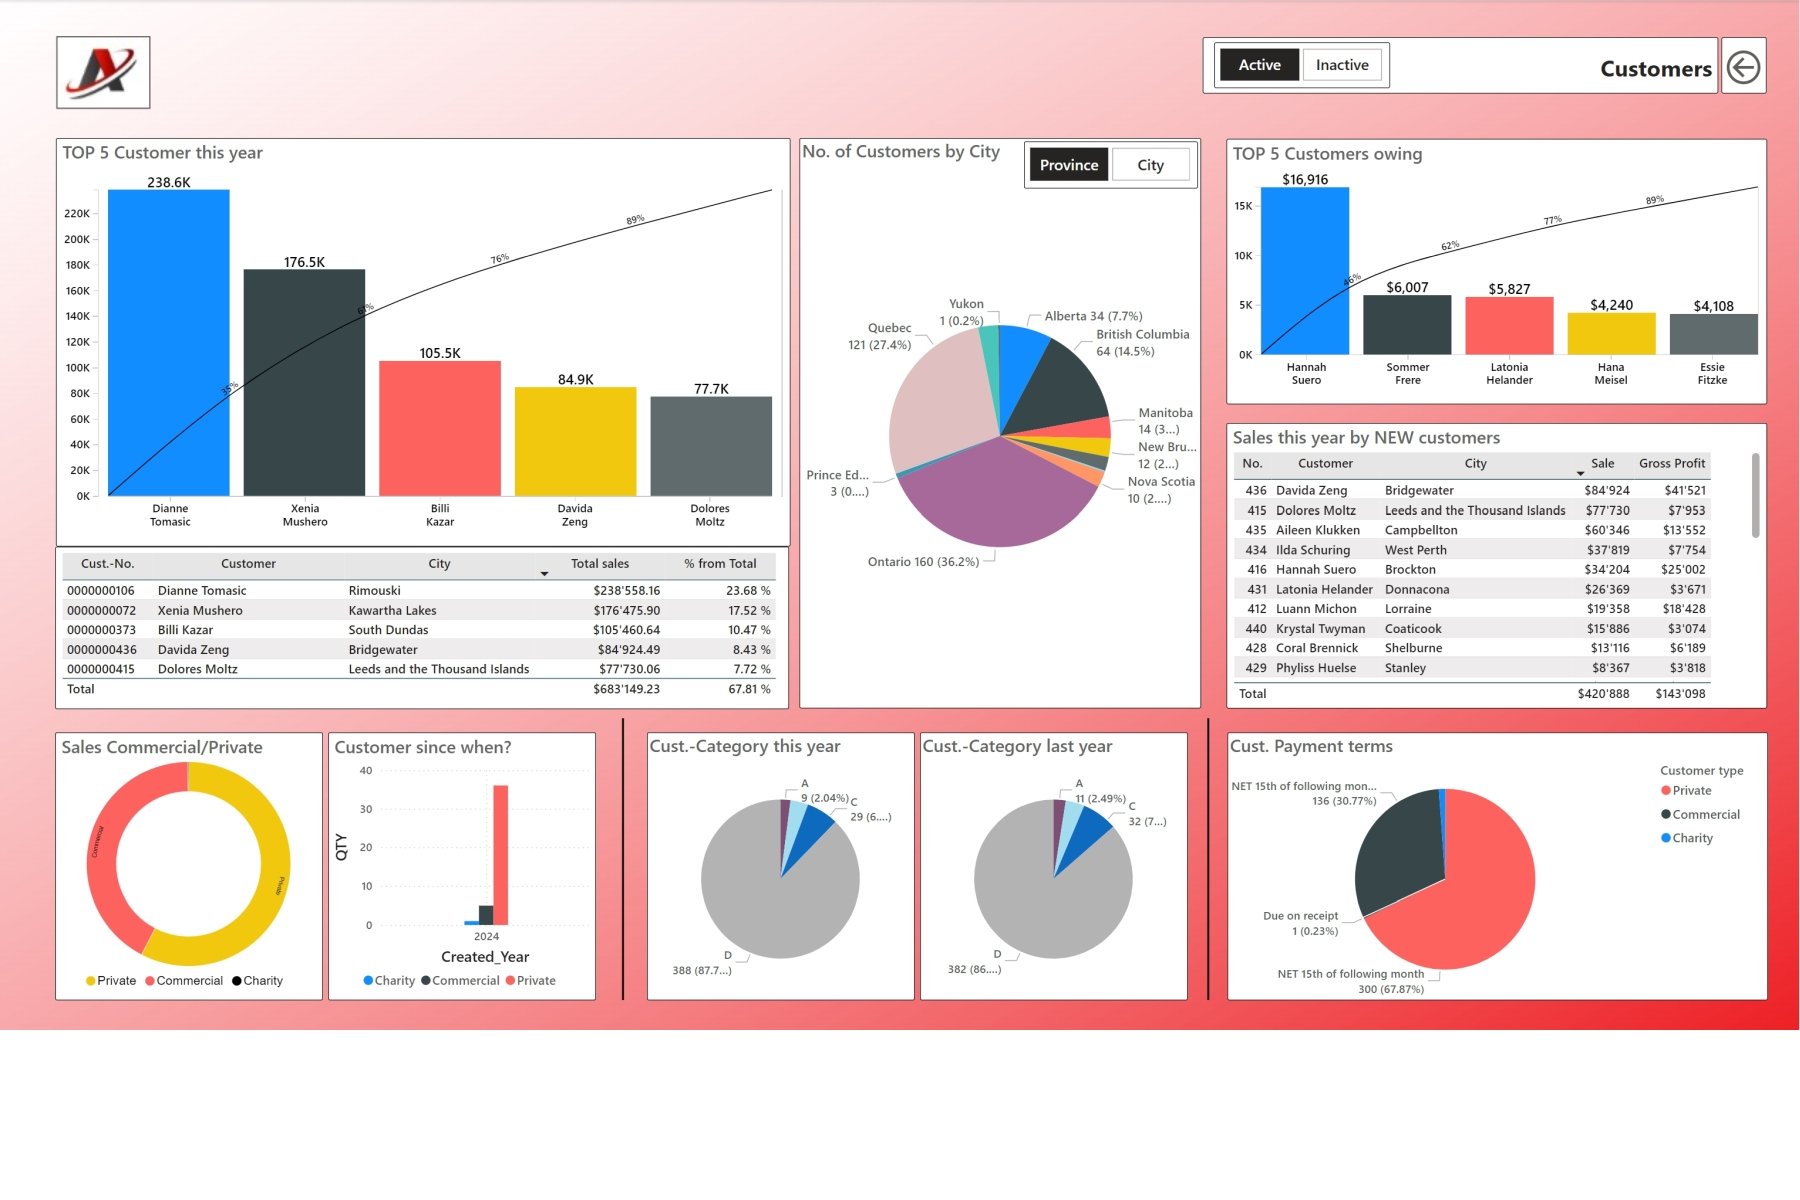
5. Top 5 customers (Example)
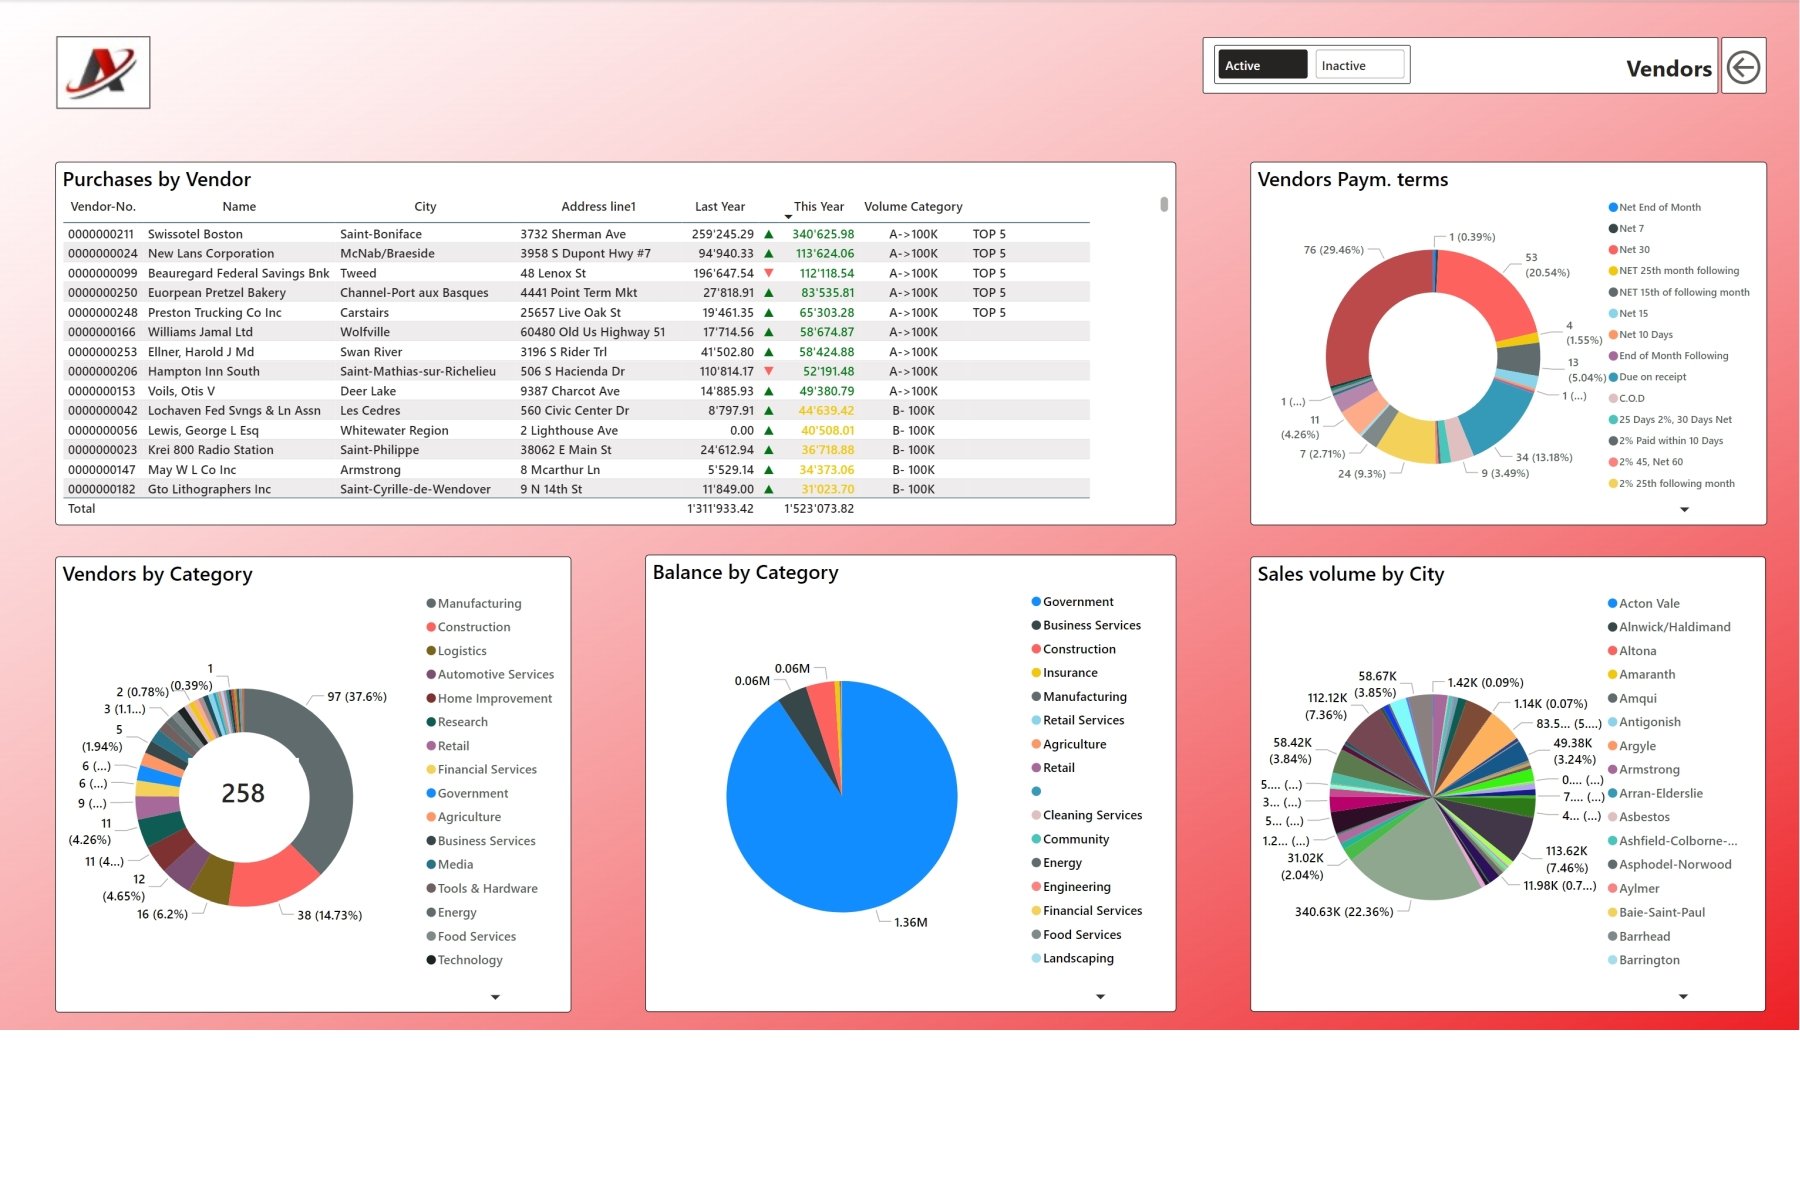
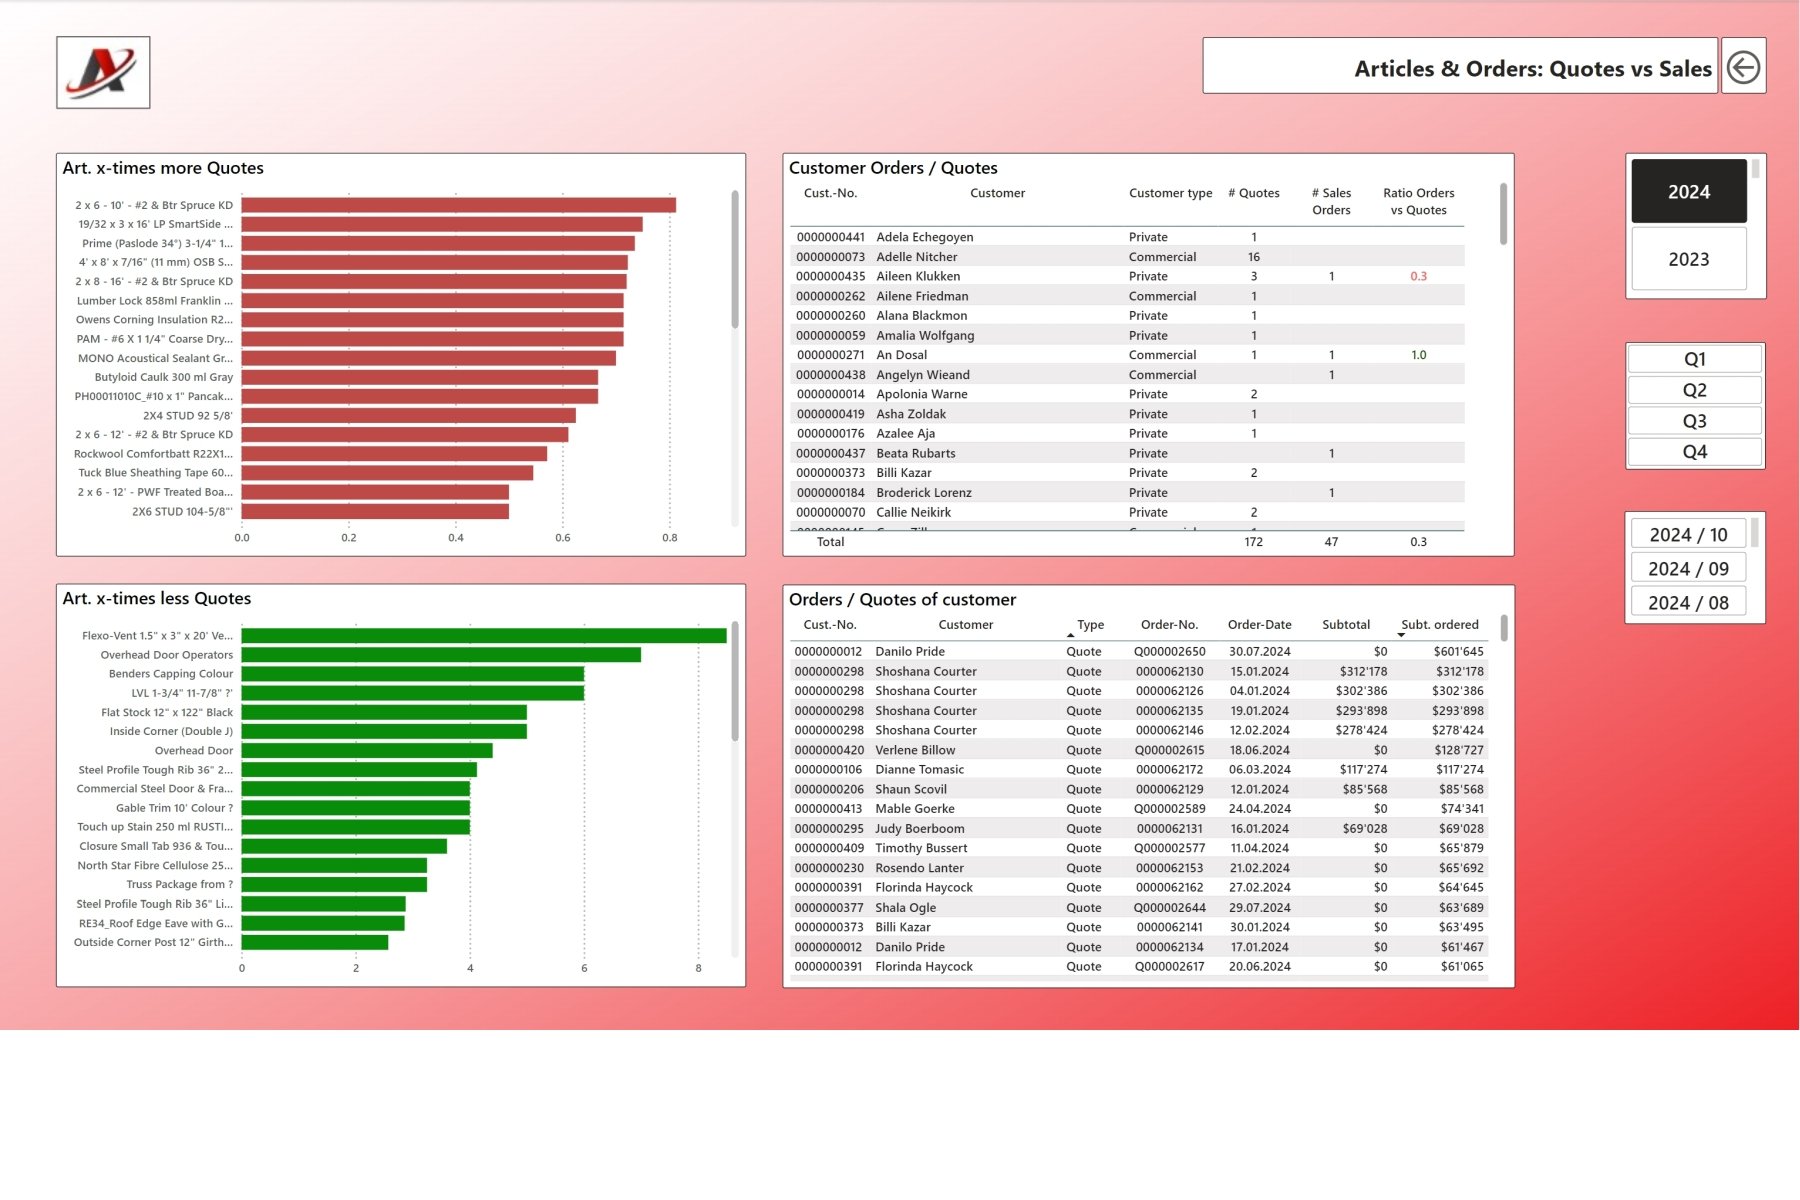
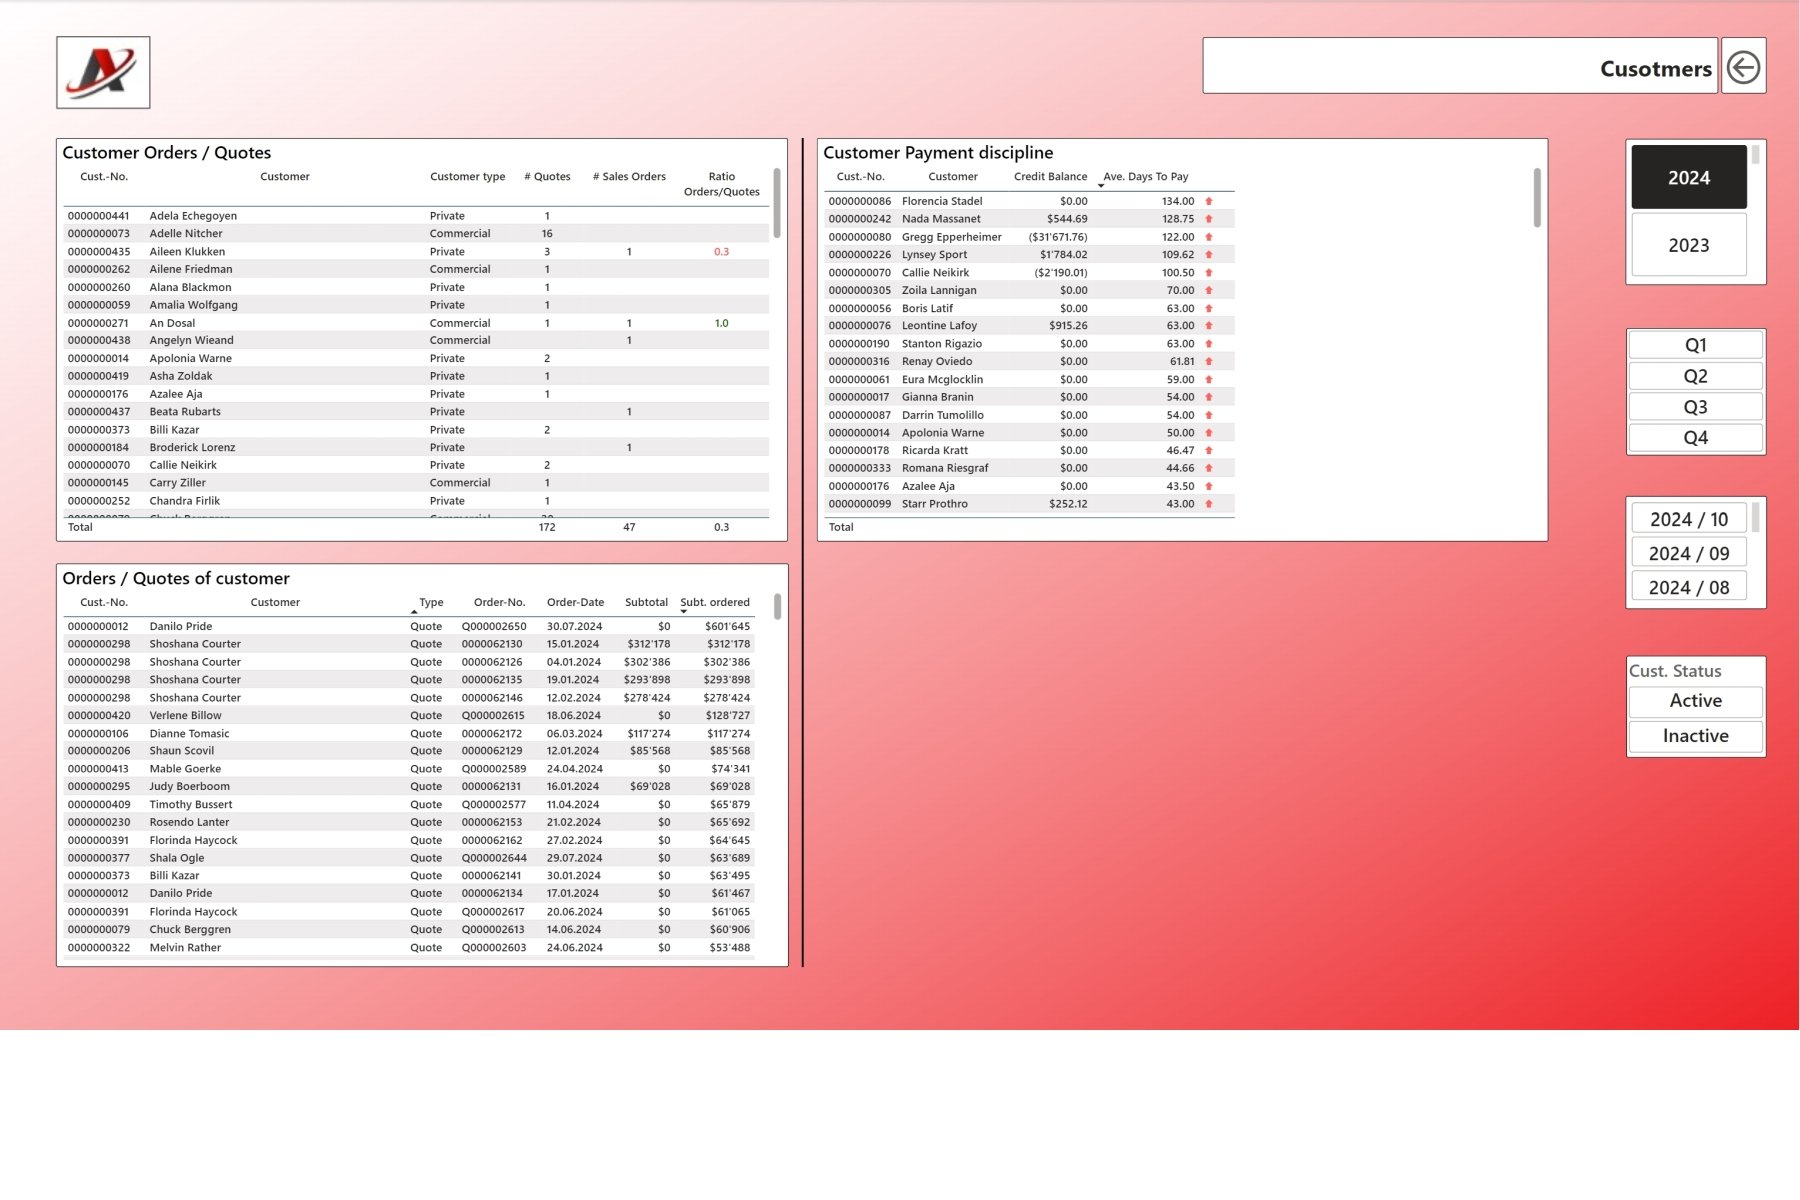
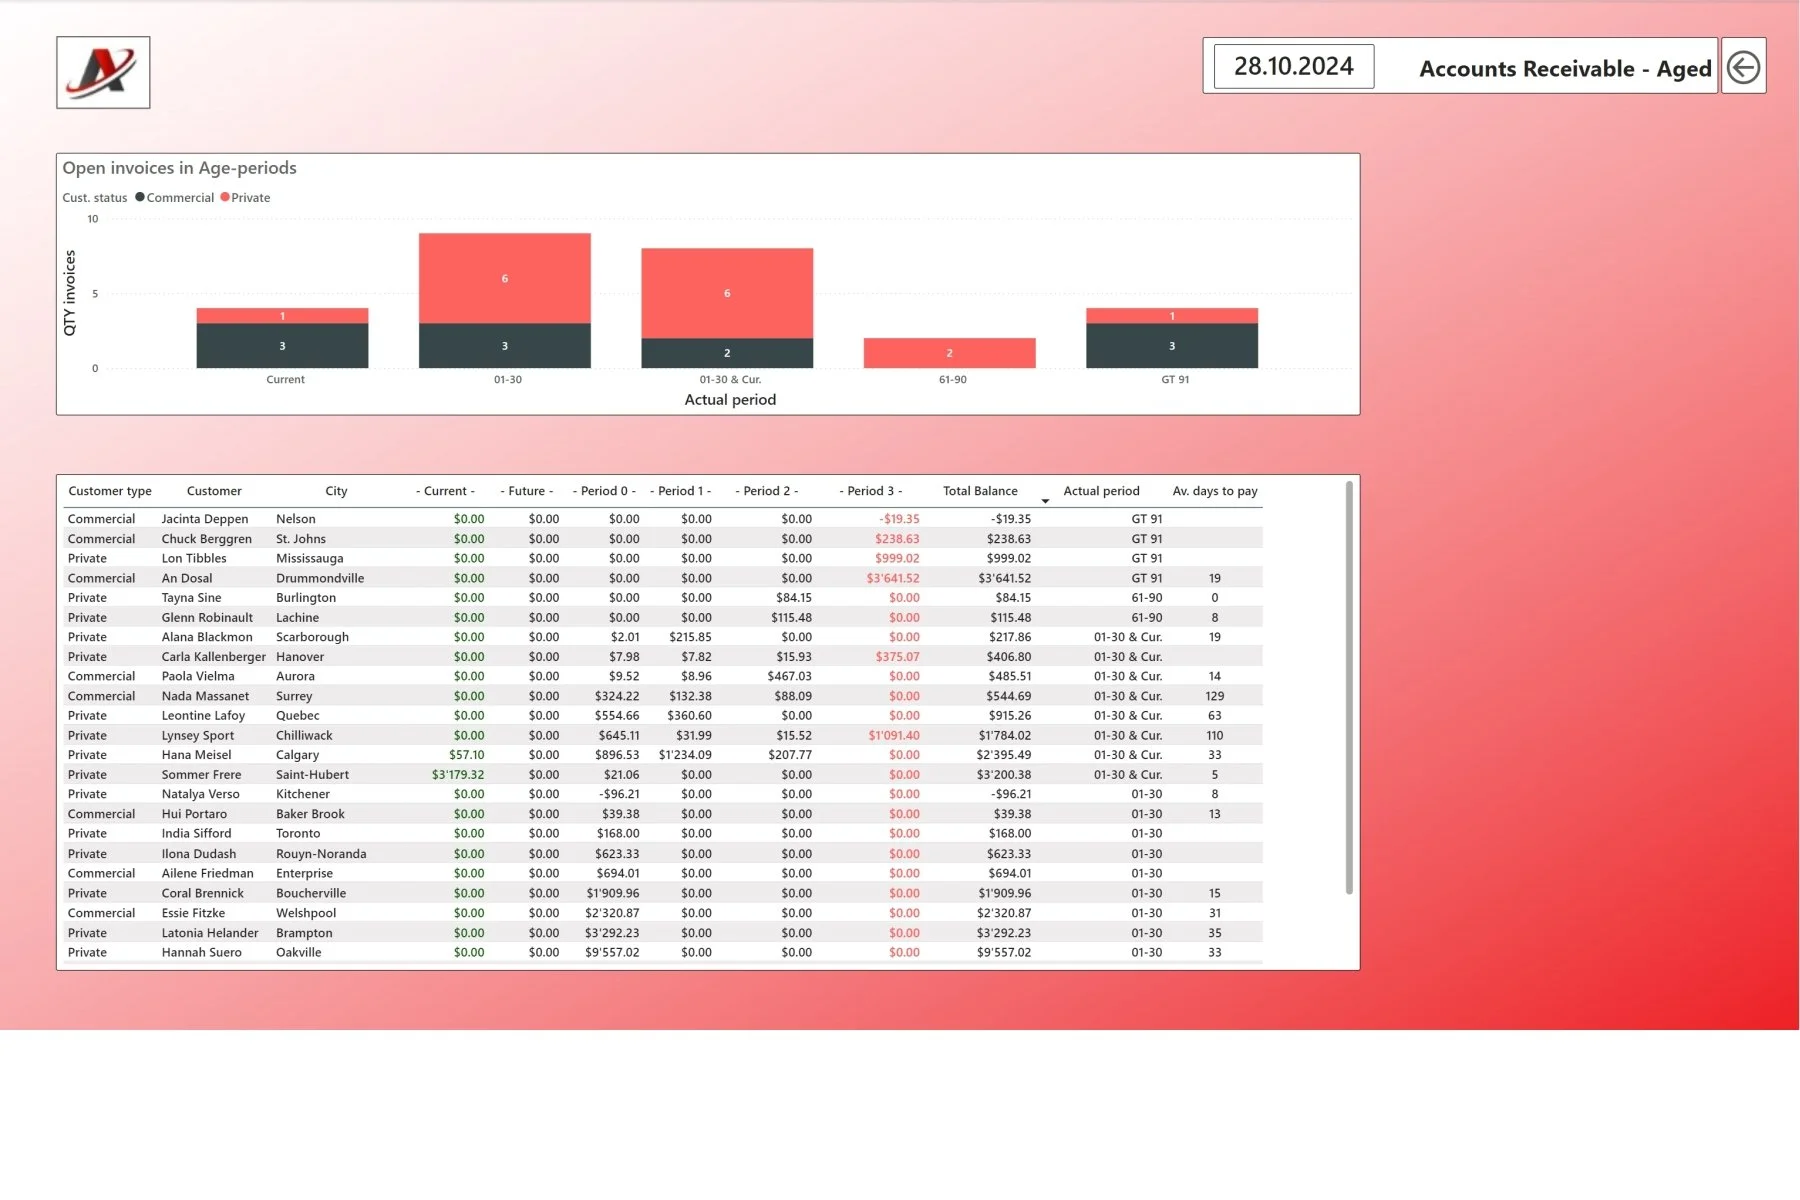
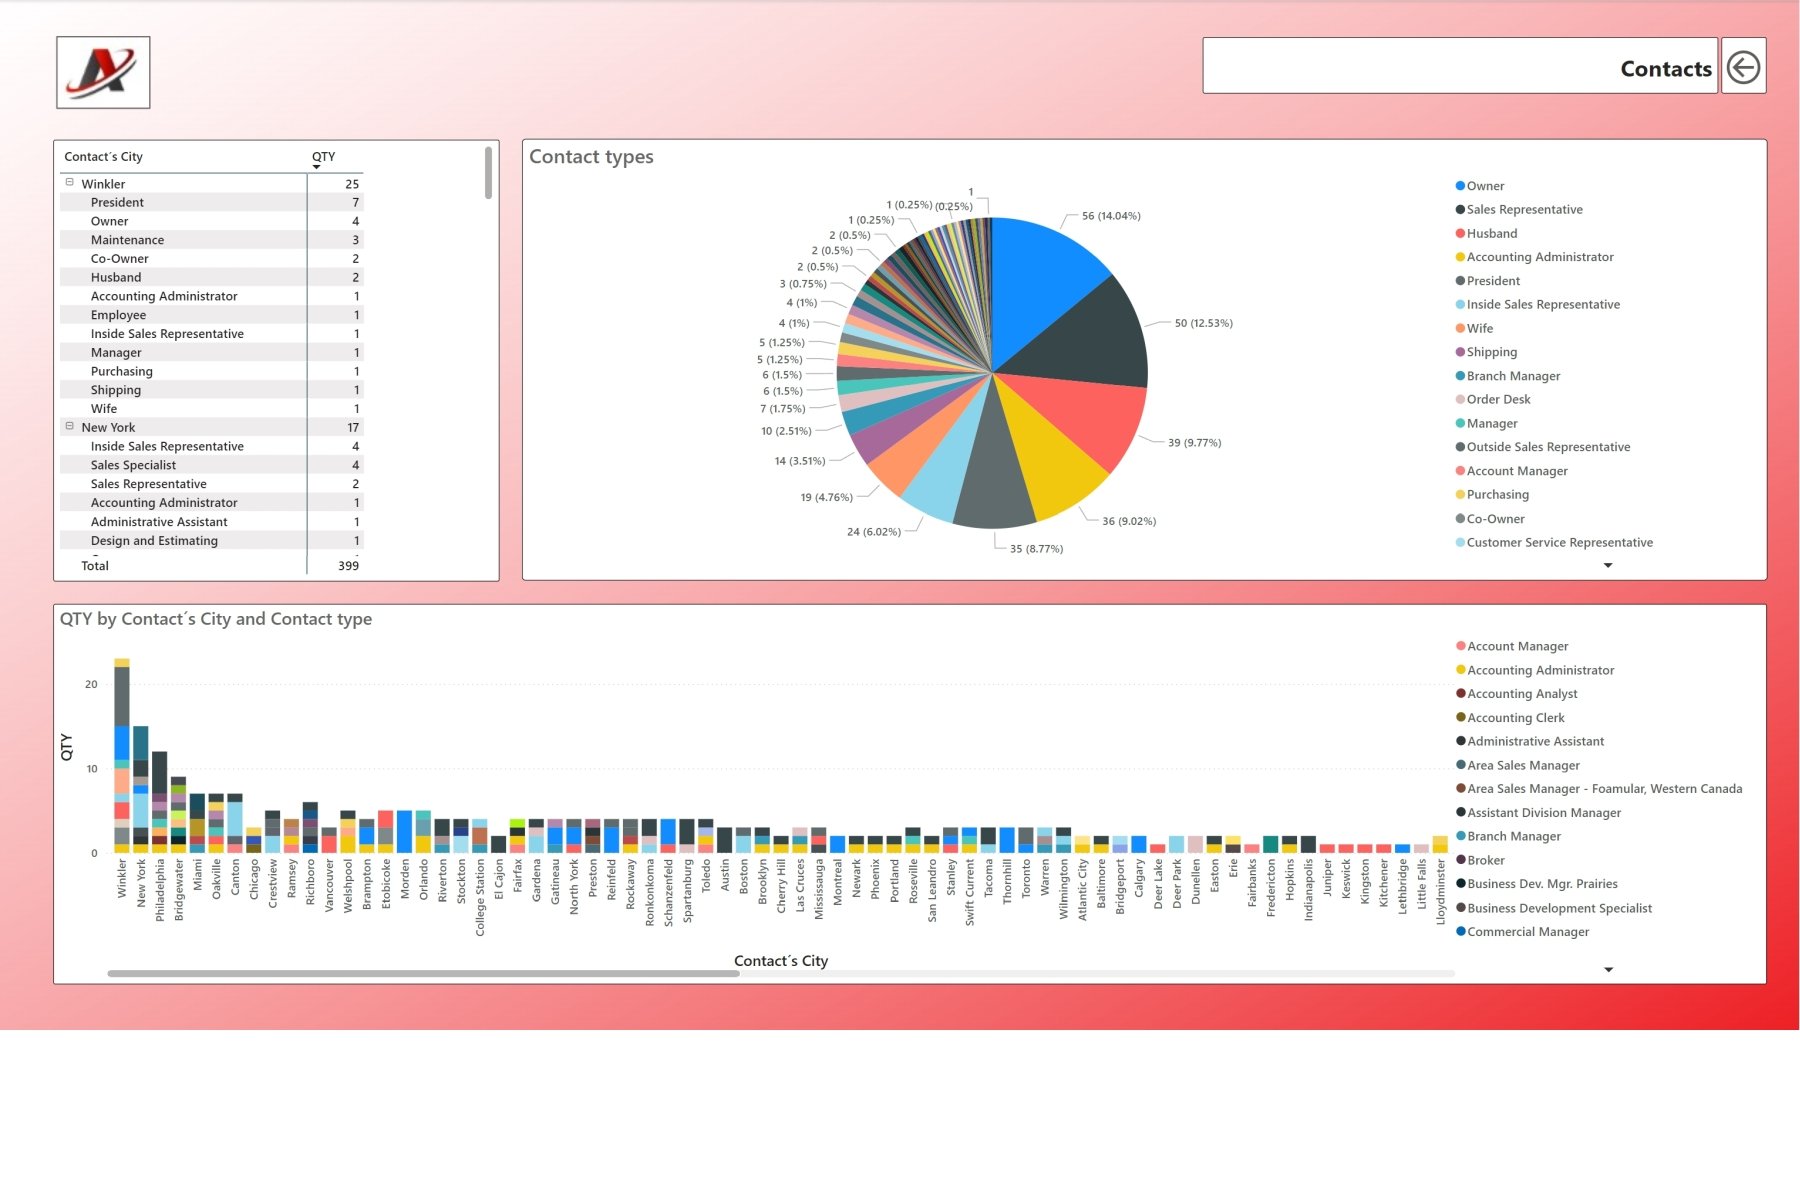
Another important part of a sales report is the evaluation of the best customers who have achieved the highest sales. Payment morale or the seriousness of requests for quotations can also be displayed.
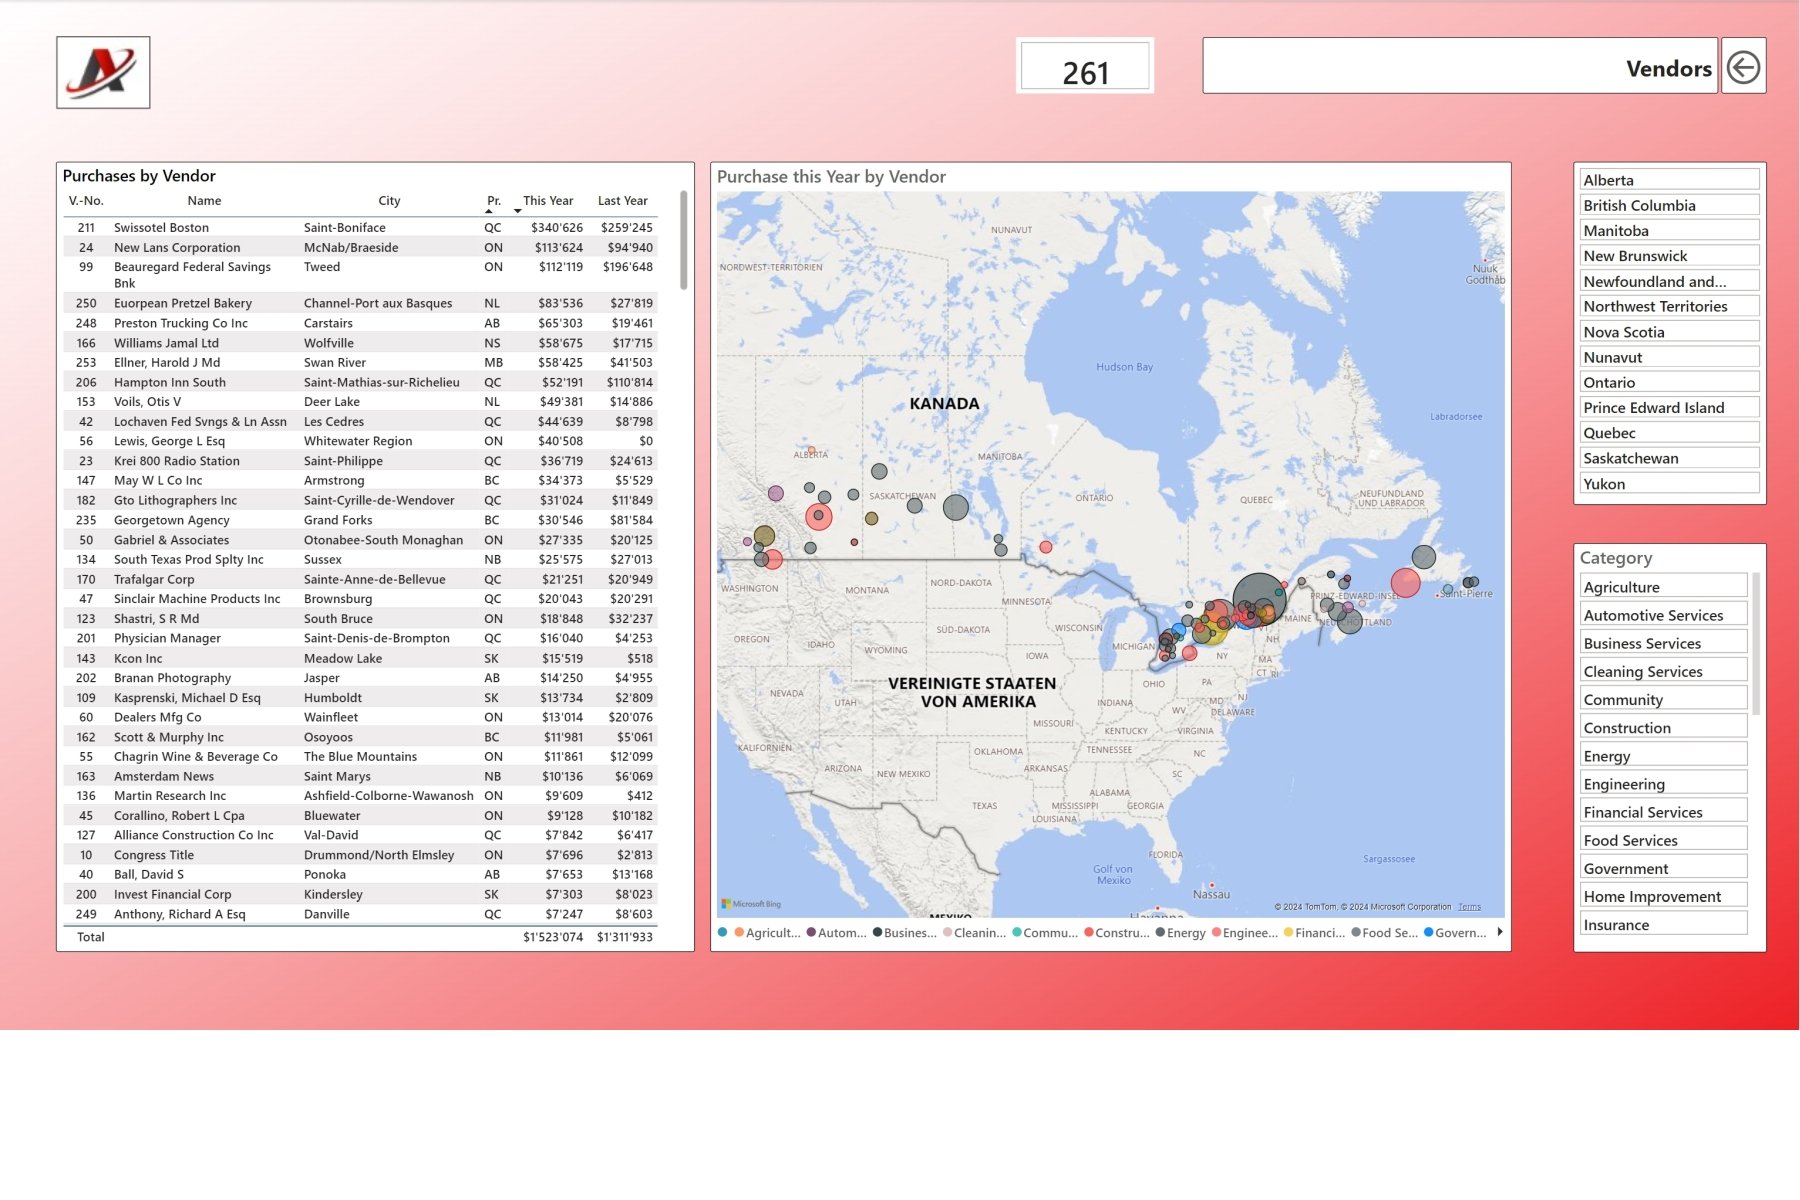
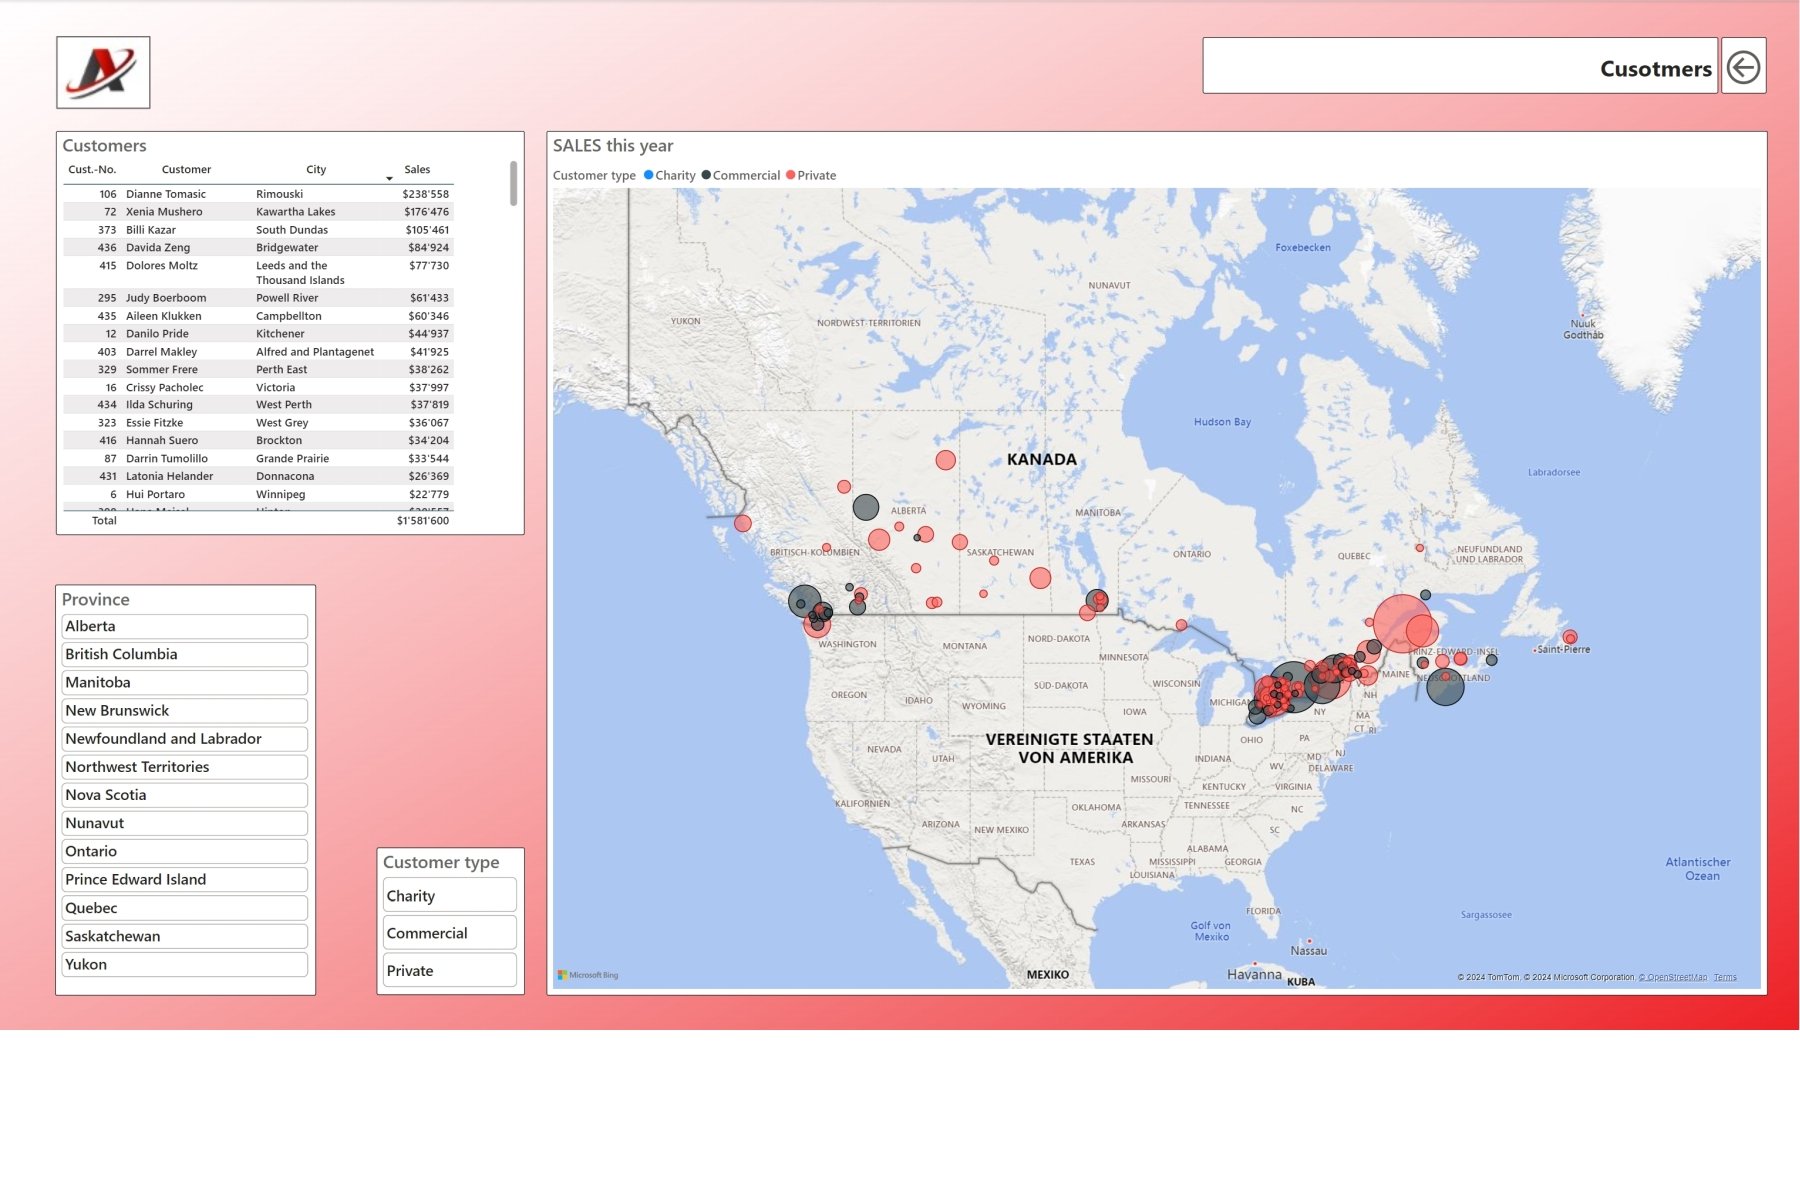
A map display shows, for example, in which areas the customers who have contributed the most to the company's turnover are located and perhaps enables targeted advertising in areas that are not yet so developed.
6. Customer-specific evaluations
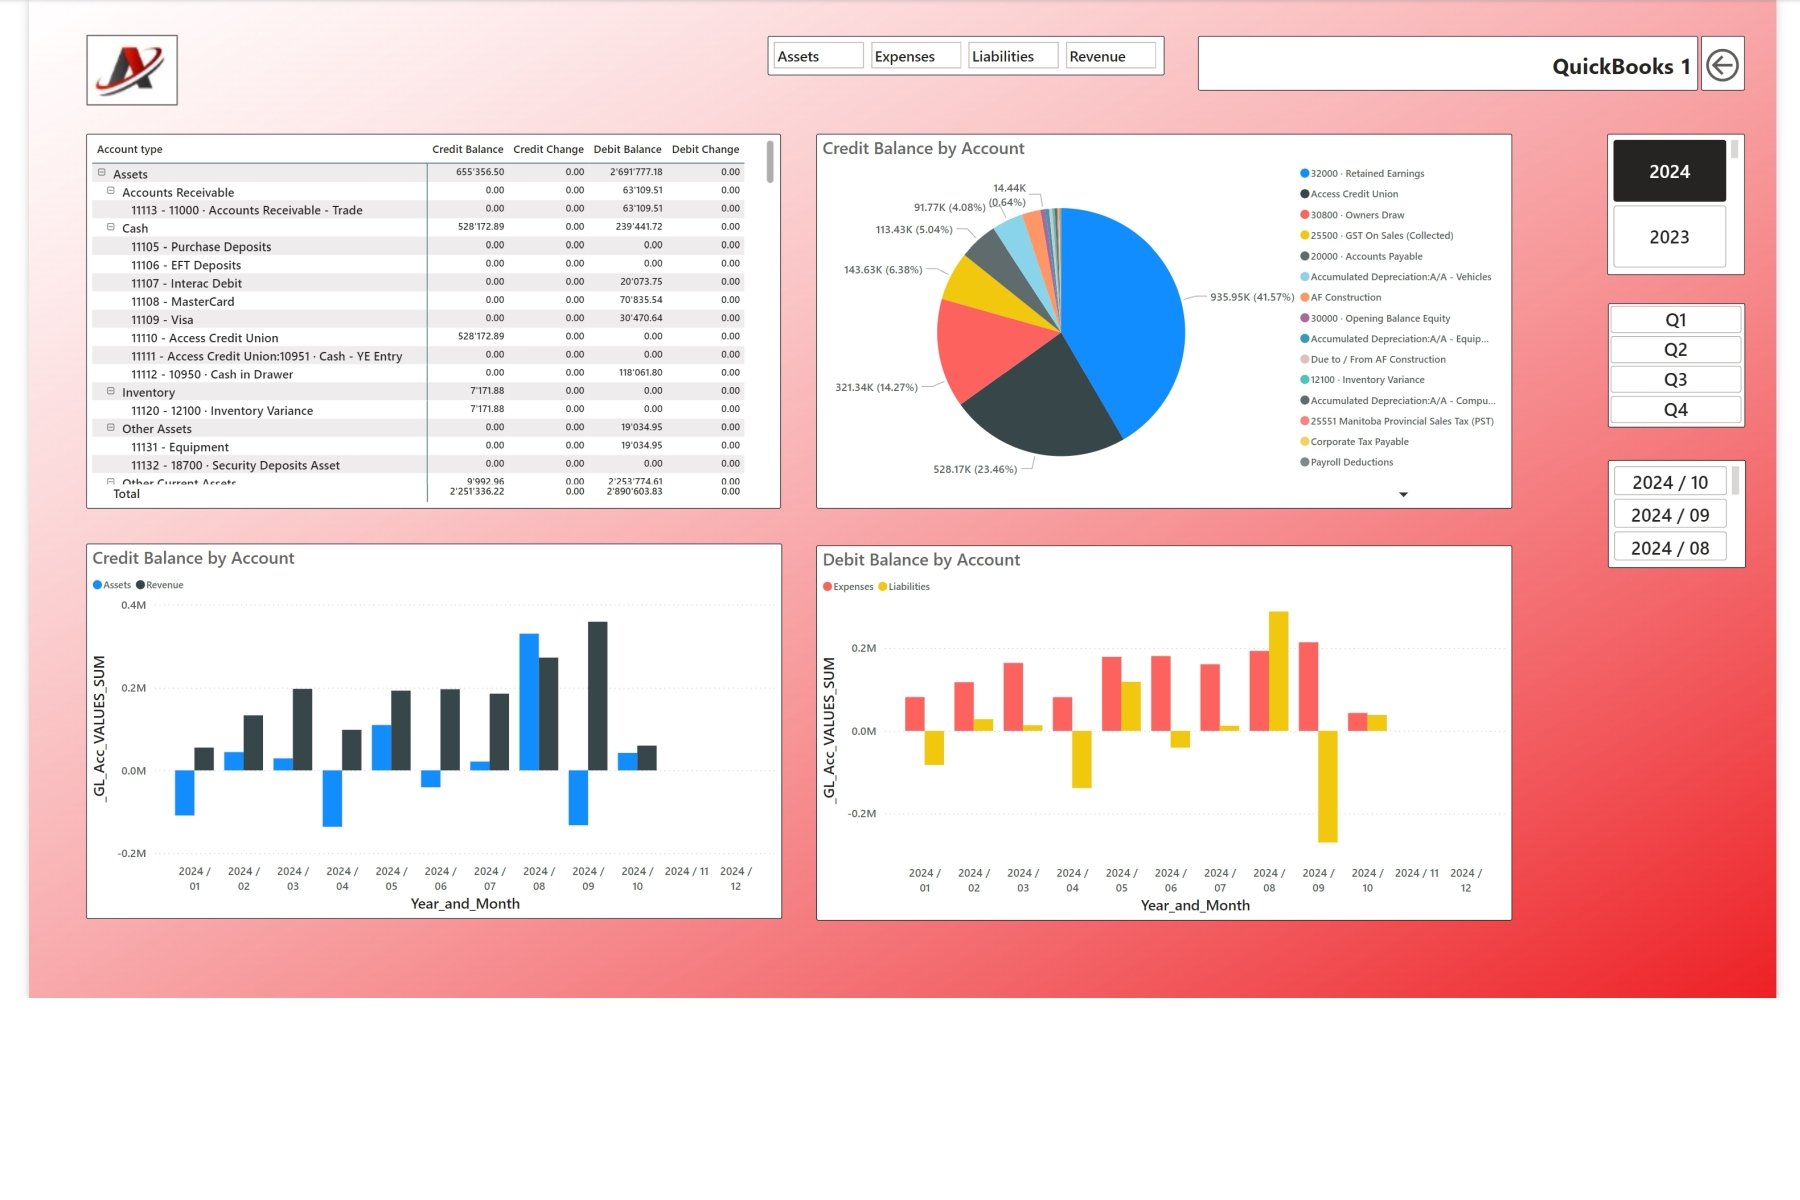
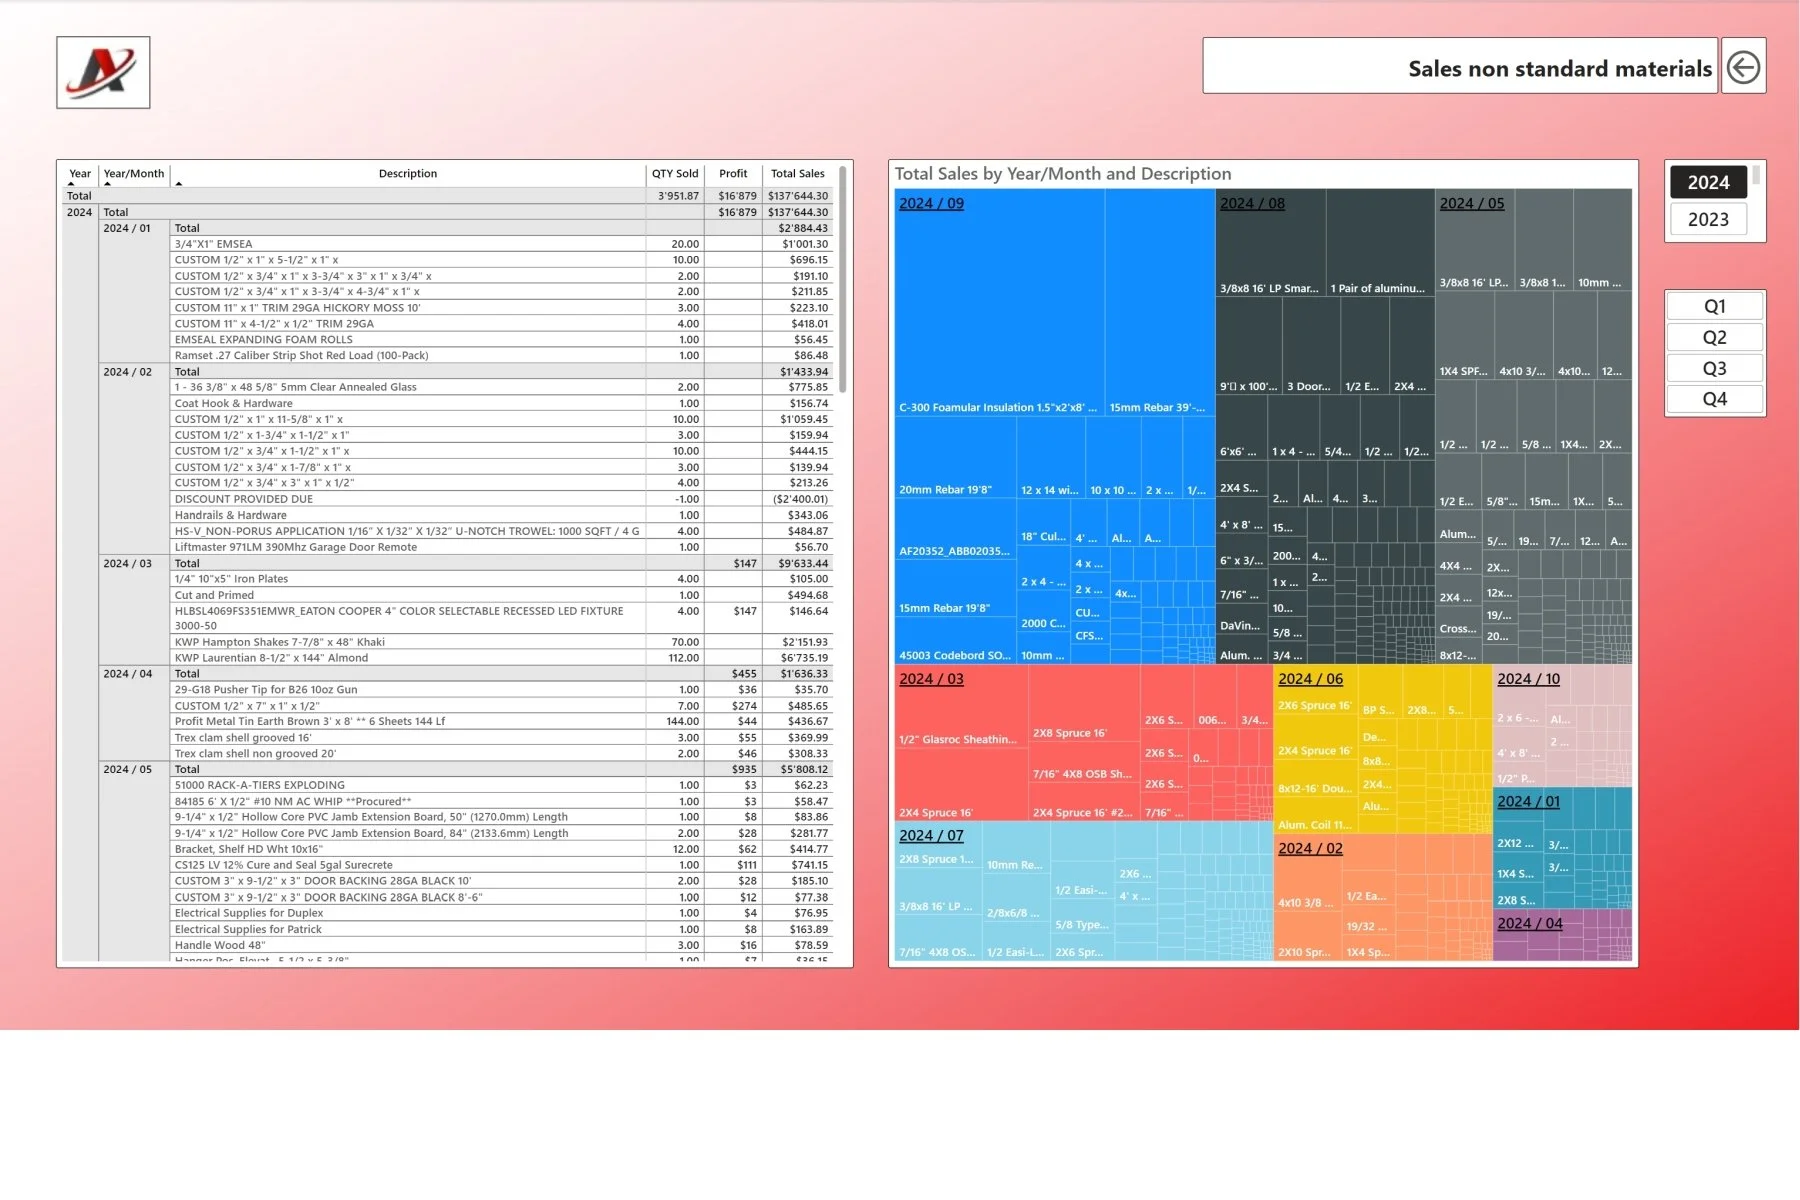
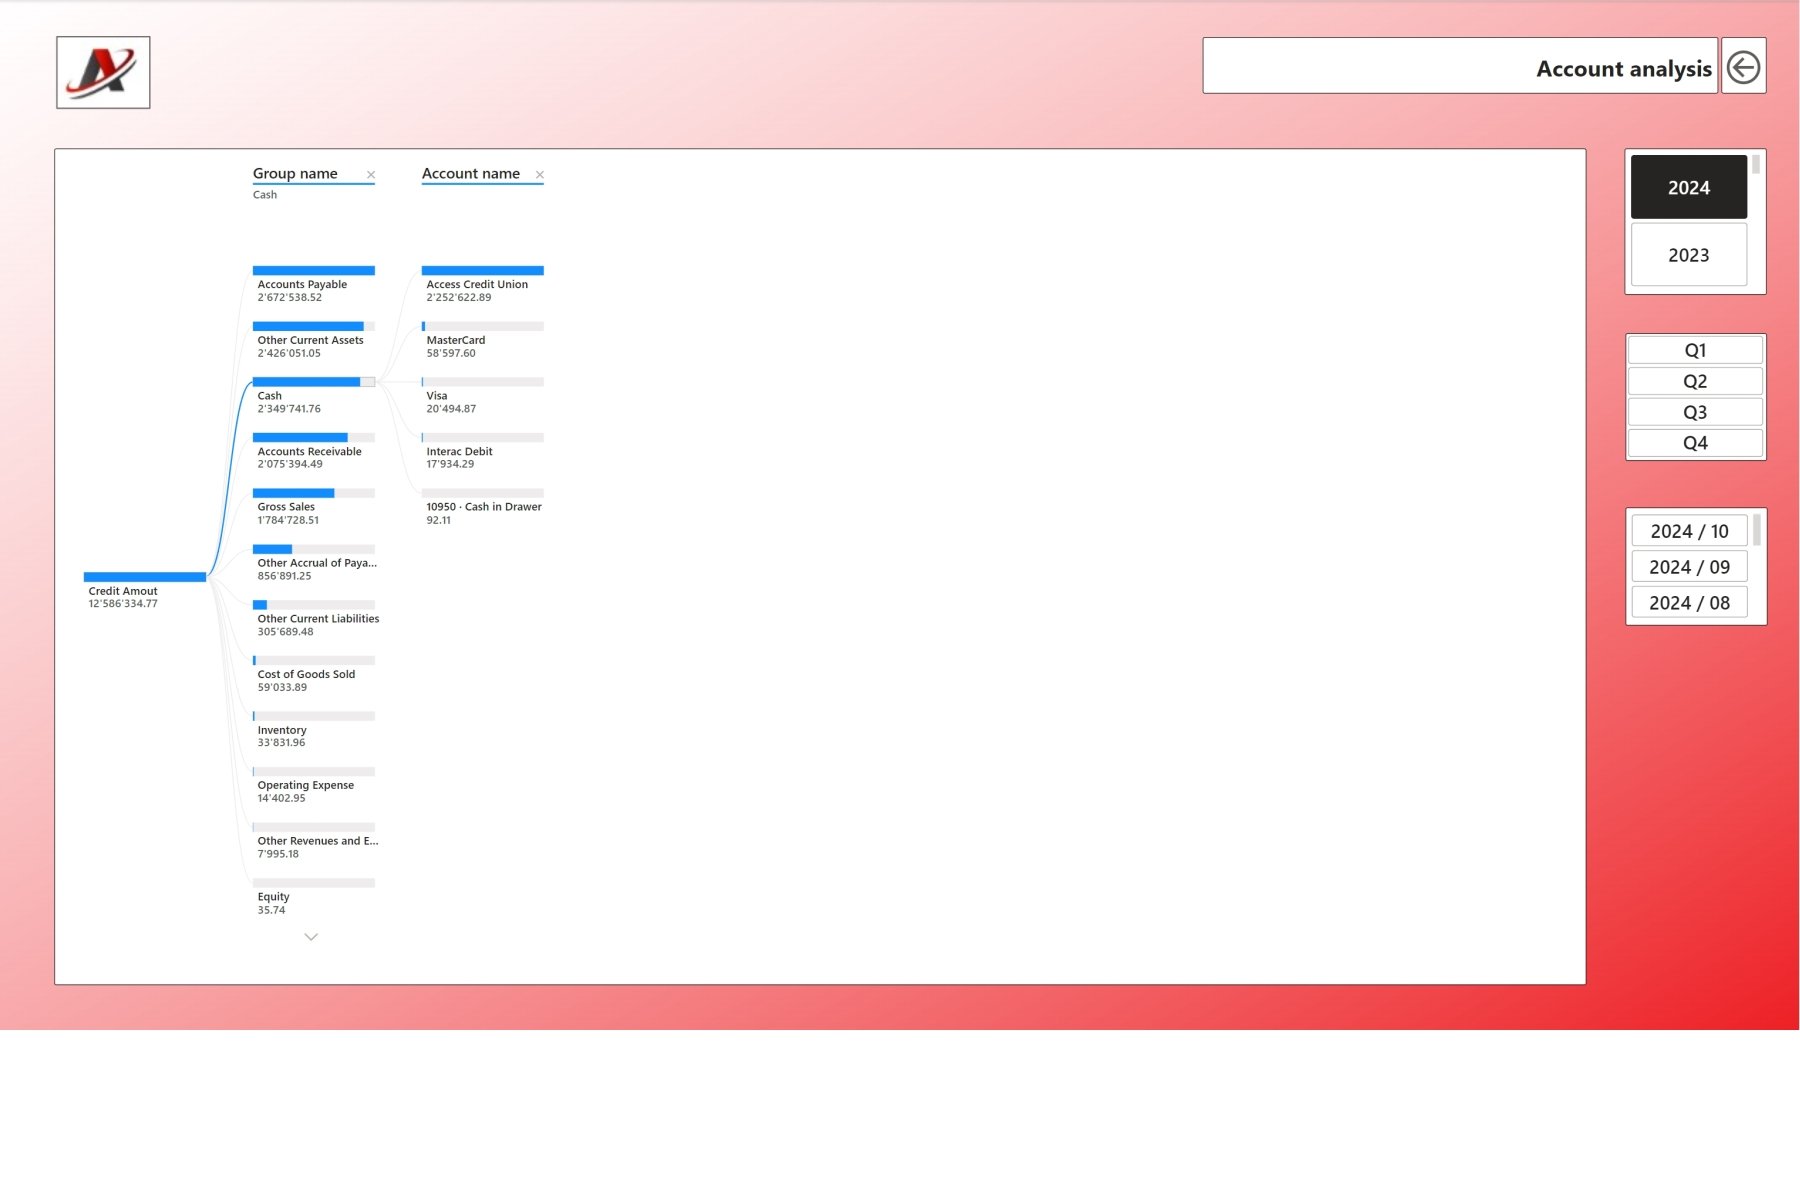
The sales report can be customized according to the specific needs of the company and the respective customer specification. It is possible to add additional fields such as payment terms, discount campaigns, geographical distribution of customers or product specifications. This data can be supplemented as required and analyzed individually in order to obtain a more complete picture of sales performance.
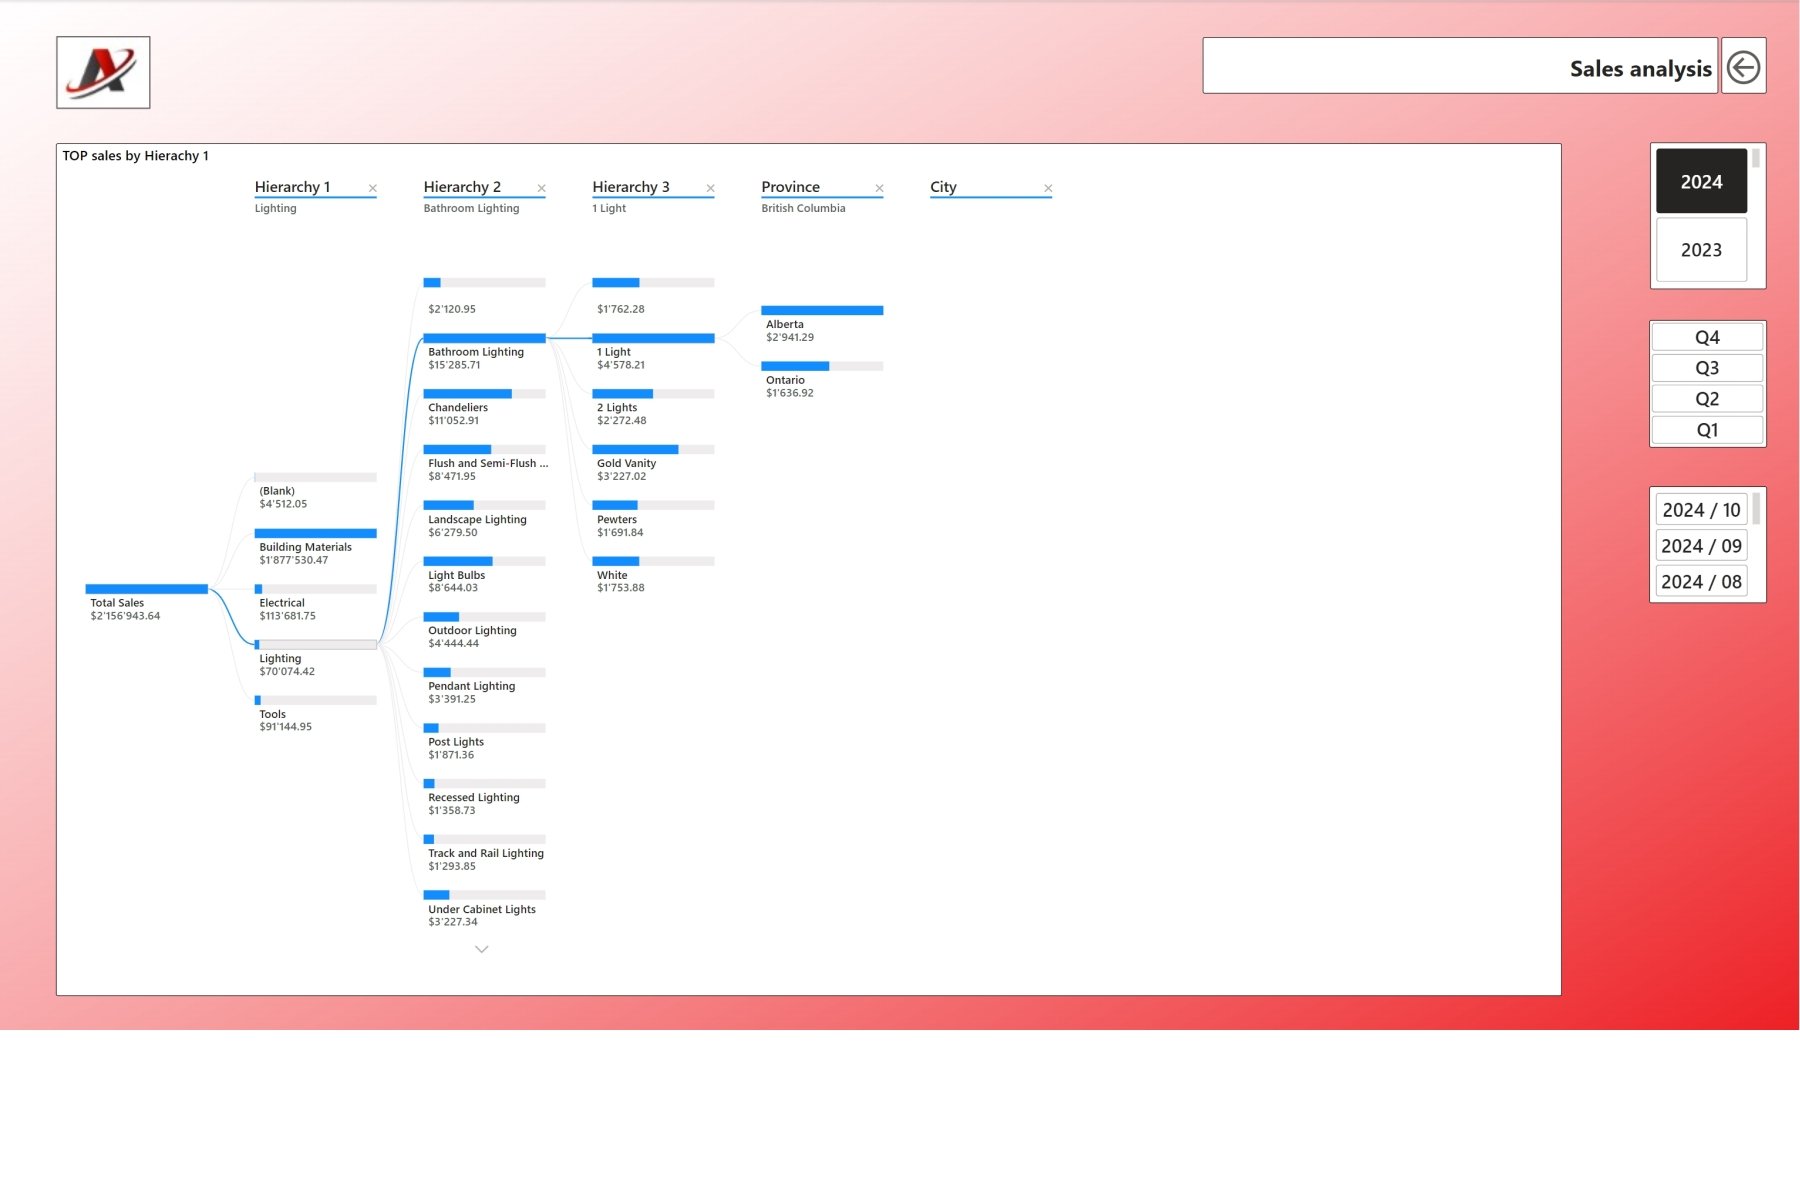
For example, an analysis by sales region or product type could be created to see which building materials were most in demand in which region.
7. Appearance and design of the report
The look, design and arrangement of the elements in the sales report are not standardized, but can be customized. Companies can decide which colors, fonts and layouts they prefer. The design can be chosen so that the report is as clear and user-friendly as possible.
The size and formatting of tables, charts and texts can be changed as required to ensure the best possible presentation of the data.
Conclusion
The sales report, shown here using a building materials retailer as an example, provides a precise overview of sales figures, product categories and customer relationships within a specific time period. The customizability of the evaluations and the addition of customer-specific fields make the report a flexible and versatile tool that can be used both for daily business analysis and for long-term strategic decisions.
The interaction and drill-through options are very helpful here, as they help to answer spontaneous questions immediately.
All diagrams and tables shown are to be understood as examples and can be adapted and detailed at any time to meet the individual requirements of the company.
