Financial report:
This financial report presents a comprehensive analysis of the financial performance, providing key insights into the organization's fiscal health for the actual period. The report includes the following sections:
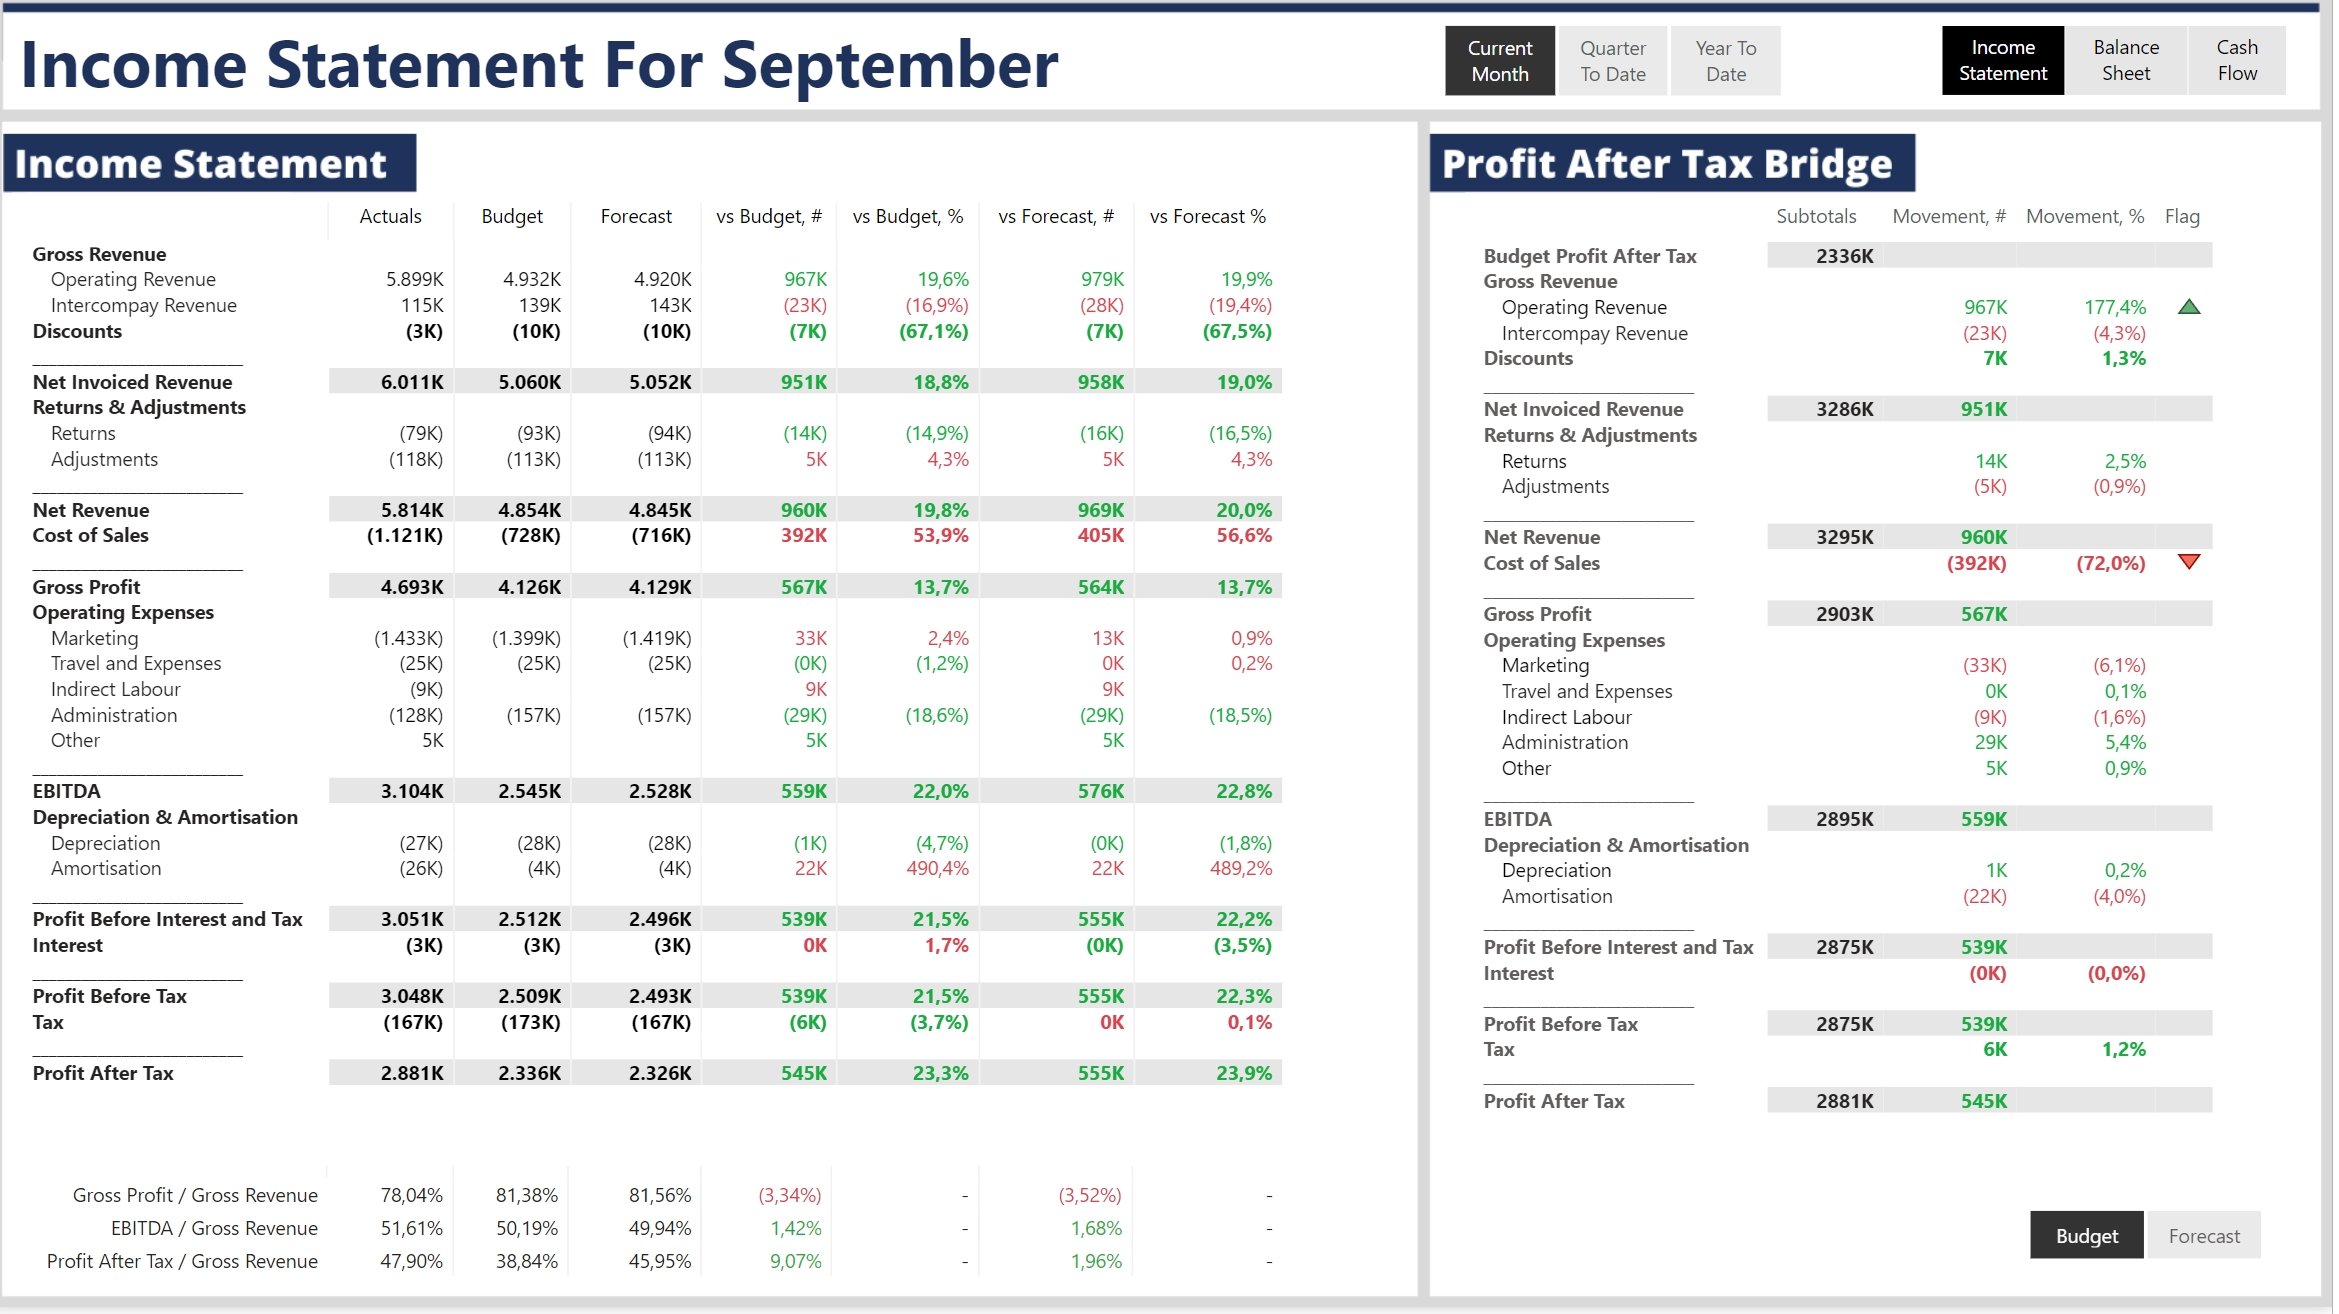
· Income Statement: A detailed overview of the company's revenue and expenses for the month, quarter, or year-to-date. A Profit After Tax (PAT) bridge is provided to highlight the key drivers of the performance variance relative to prior periods.
· Budget/Forecast Comparison: A comparison of actual financial results against budgeted figures or forecasts, offering a clear picture of our performance relative to planned financial targets.
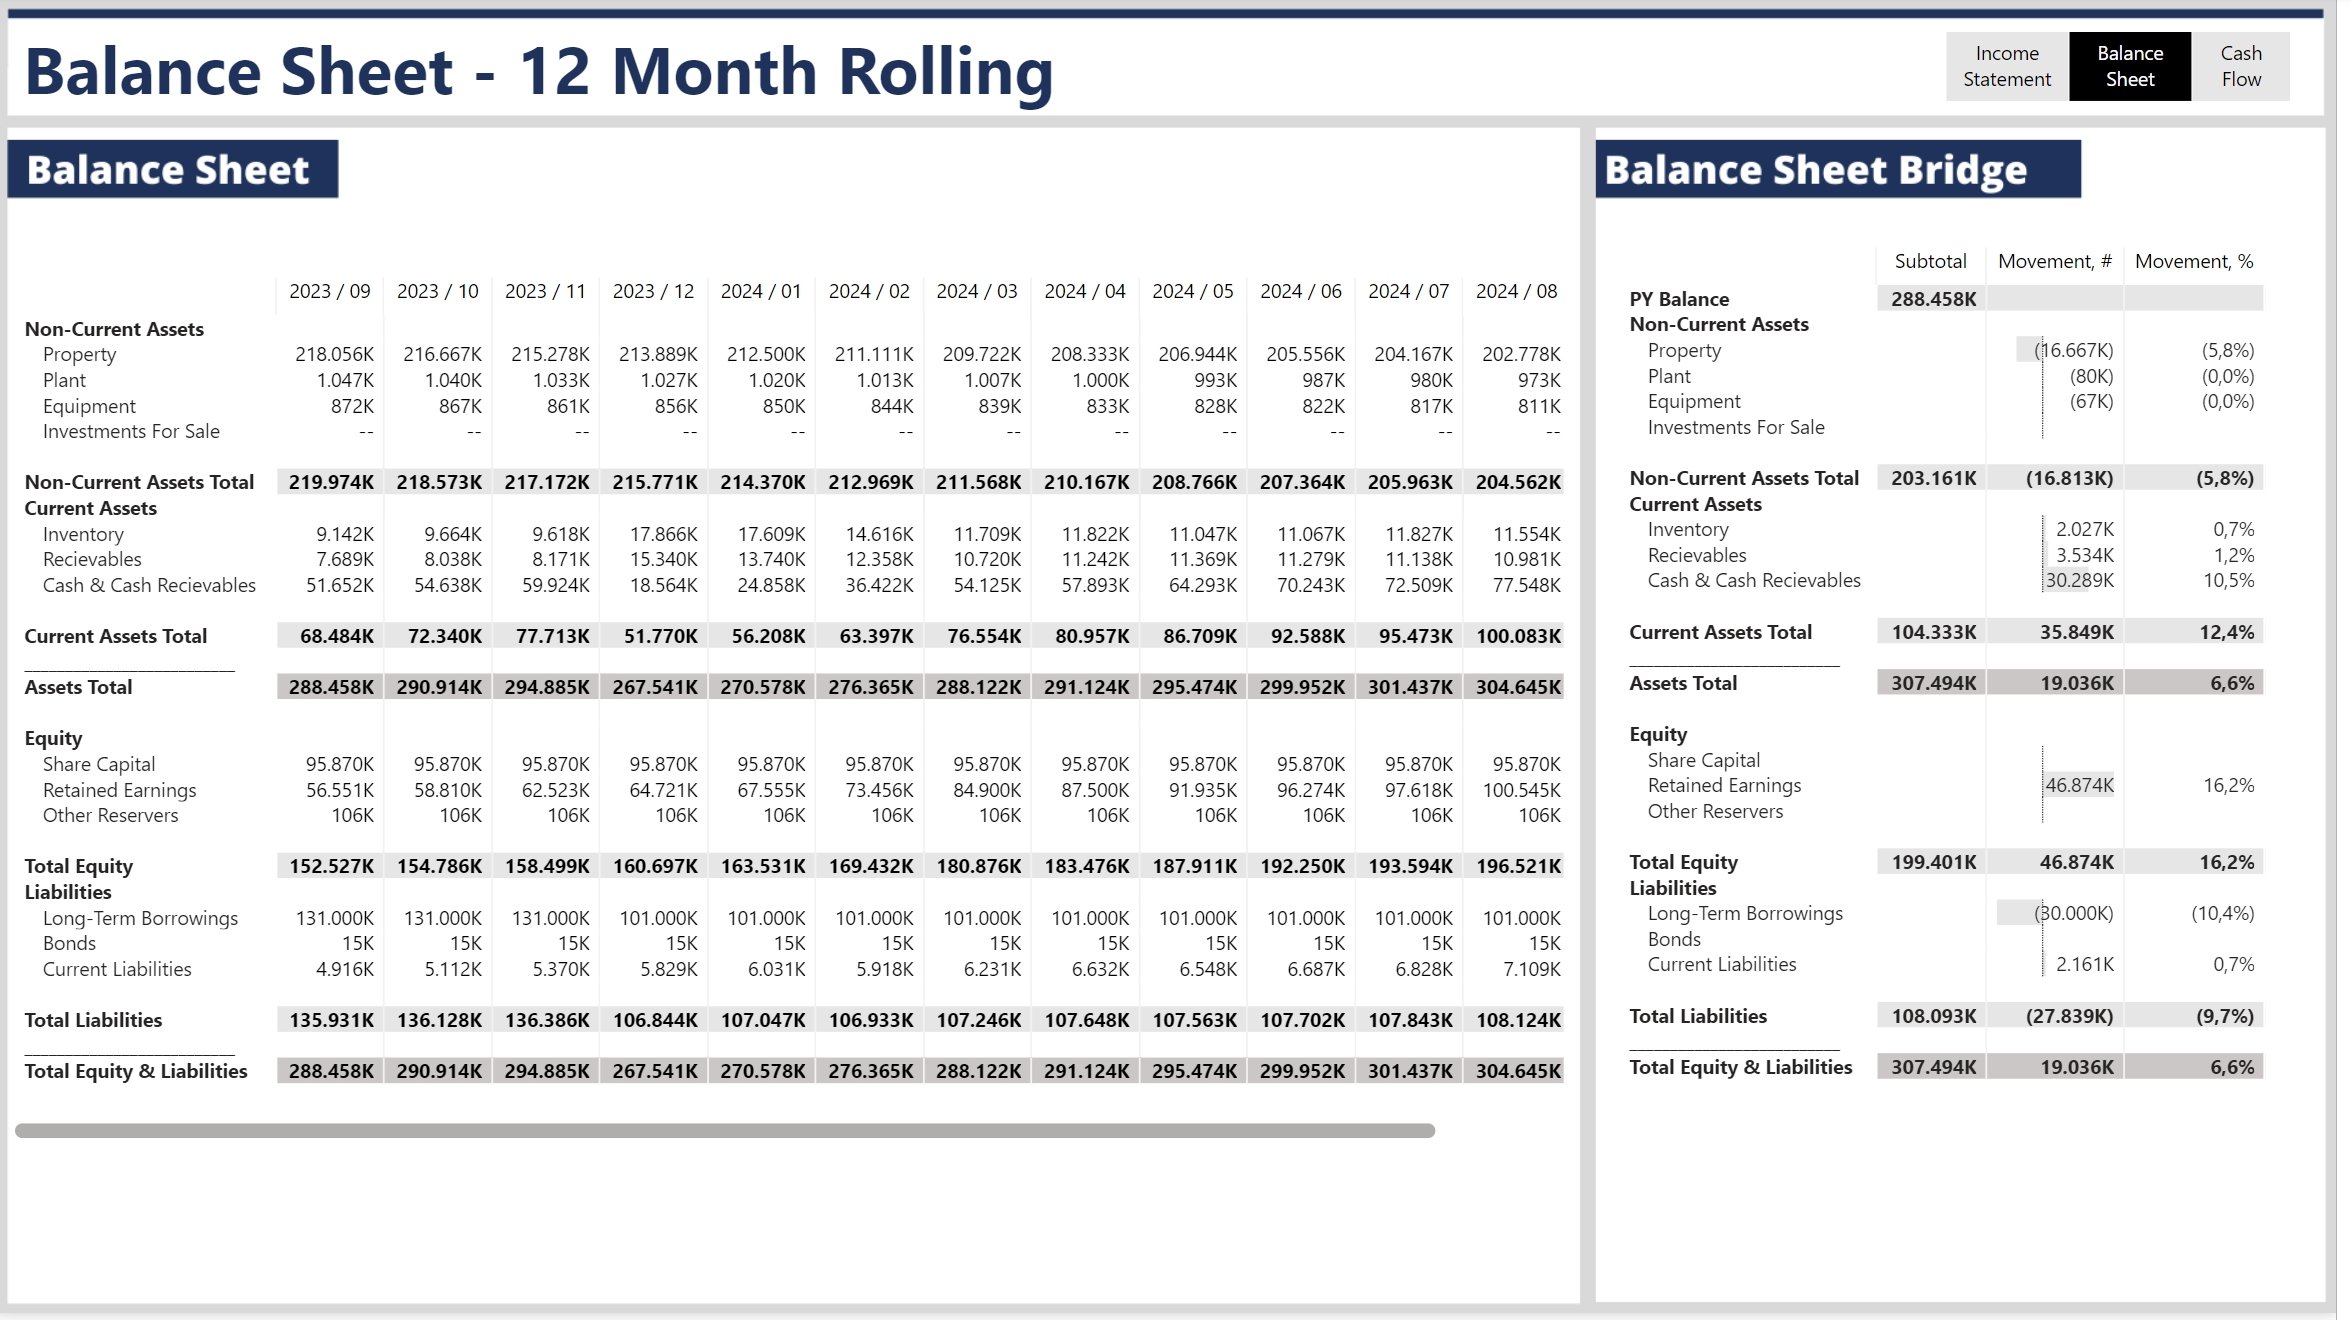
· Balance Sheet: A snapshot of the company's financial position with a rolling 12-month balance sheet. A balance sheet bridge is also included to explain the movements in key assets, liabilities, and equity over the reporting period.
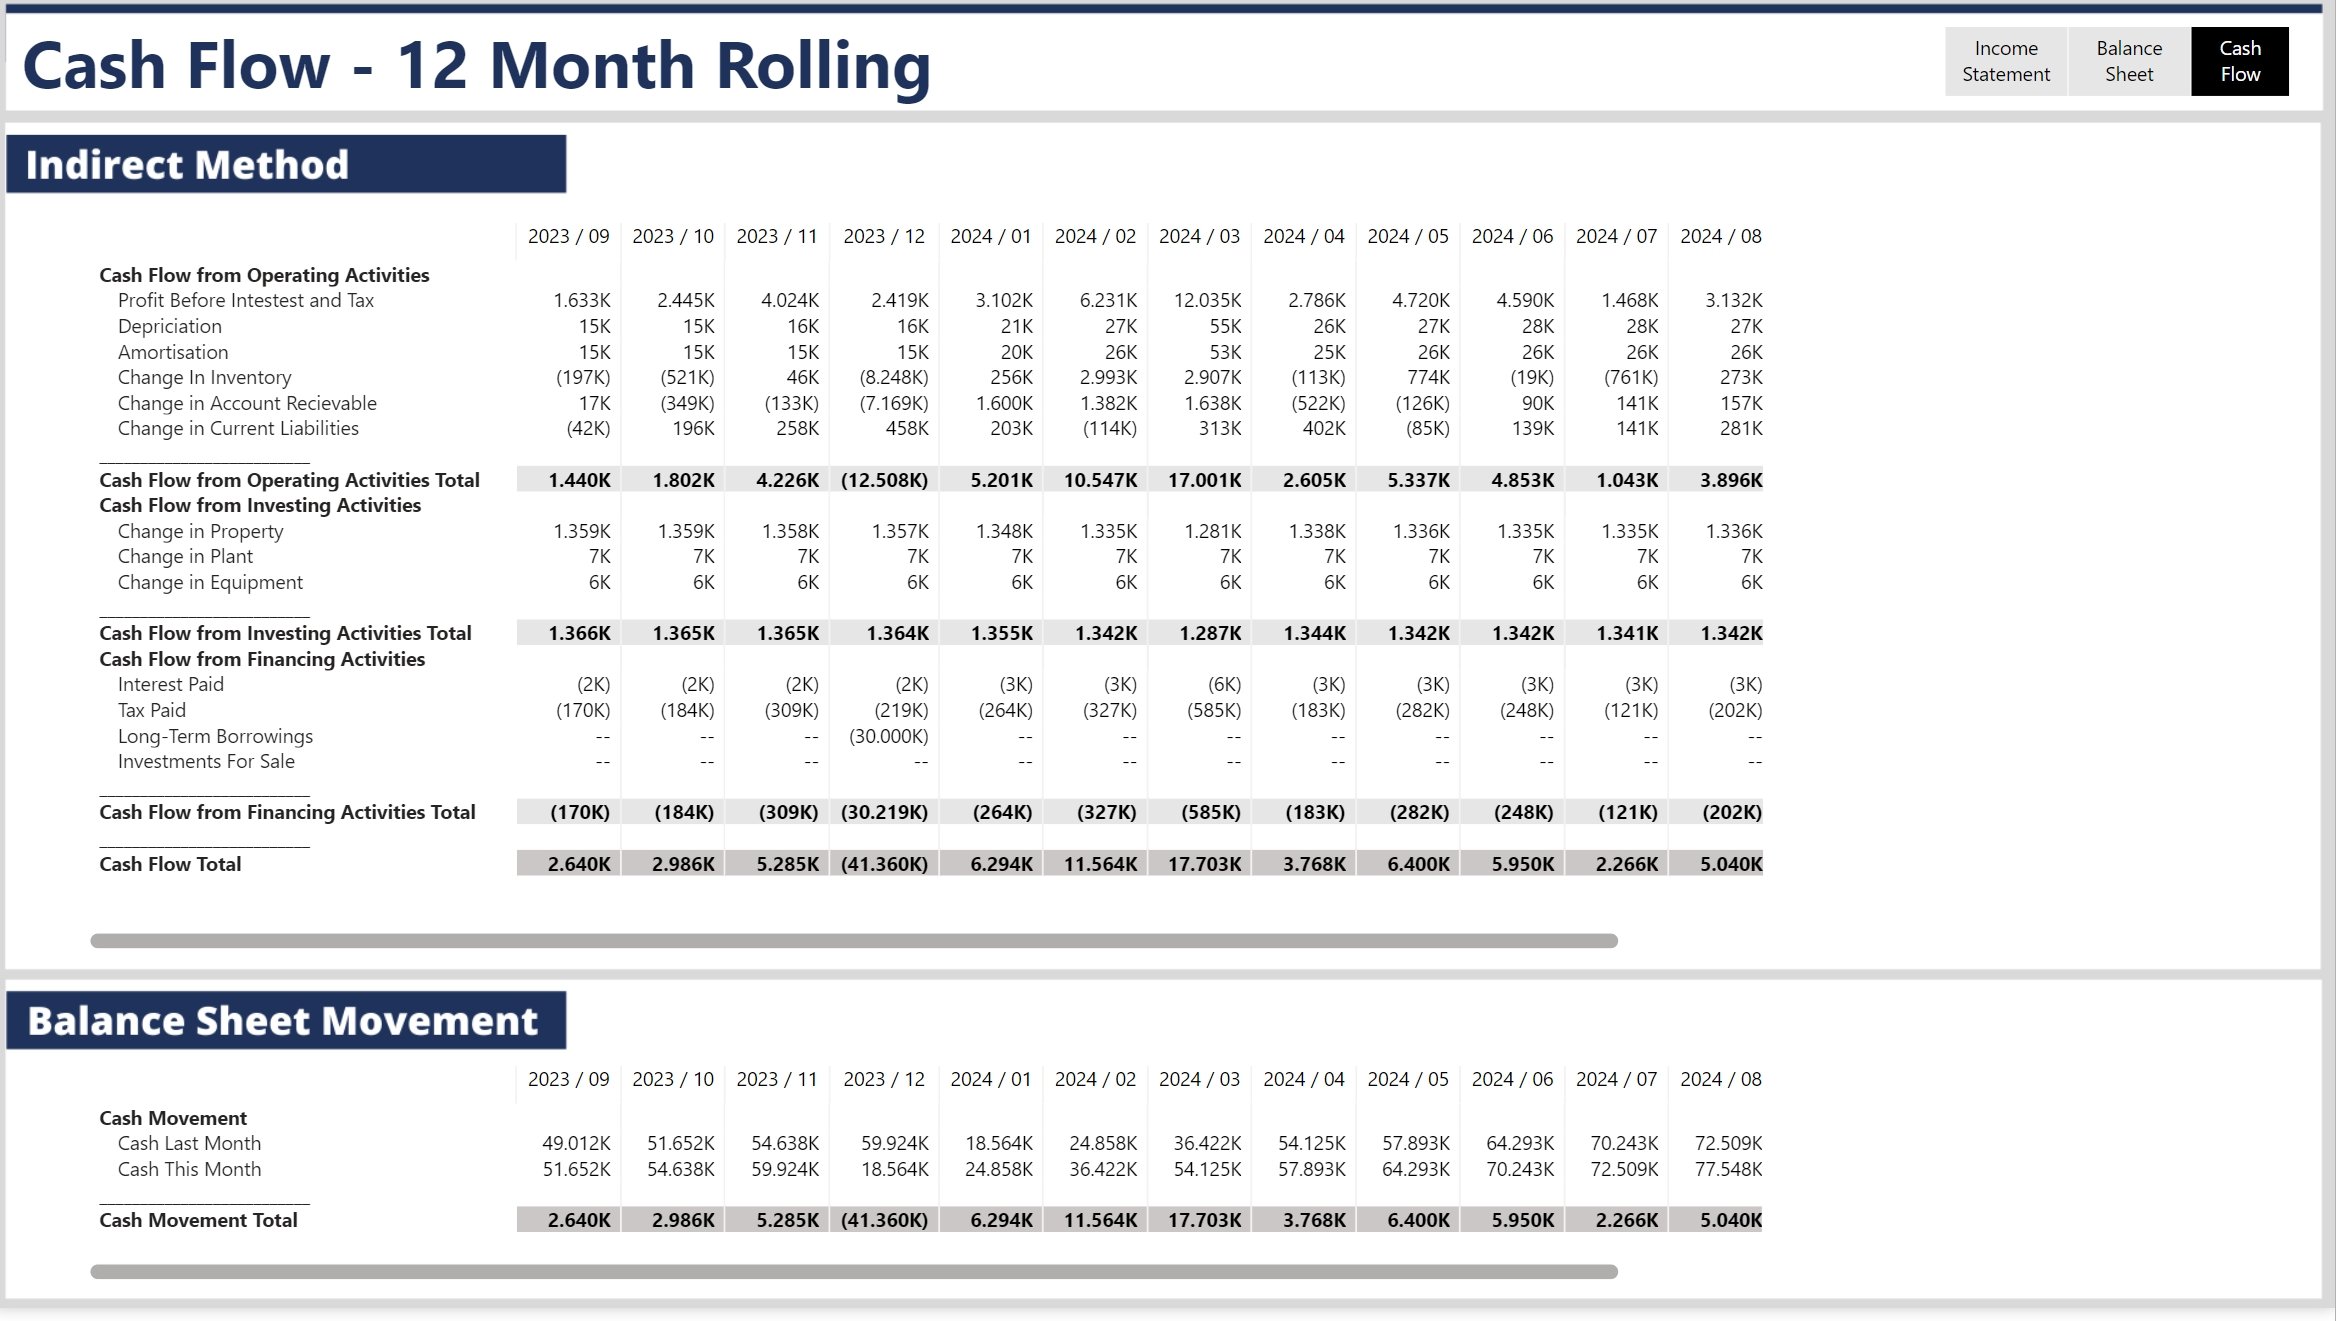
· Cash Flow Statement: A presentation of cash inflows and outflows for the past 12 months, prepared using the indirect method. This section also includes an analysis of the balance sheet movement, helping to explain cash flow fluctuations in the context of changes in working capital and other balance sheet items.
Together, these sections offer a detailed view of our financial trajectory, enabling a clear understanding of operational performance, financial stability, and liquidity trends.


